Dashboards | RS On-prem
What are dashboards?
Dashboards provide real-time visualizations of key performance indicators (KPIs) for your help desk. They display data such as representative availability, session durations, and active or closed session details.
How are dashboards useful?
Dashboards help monitor and analyze your help desk's performance, allowing you to identify trends, optimize workflows, and make data-driven decisions to enhance productivity and efficiency.
How do I access the Dashboards page?
- Use a Chromium-based browser to sign in to your Remote Support URL.
This URL is provided in the BeyondTrust welcome email and includes your site URL followed by /login. - From the left menu, click Dashboards.
The Dashboards page opens and displays by default.
Add a dashboard
- Use a Chromium-based browser to sign in to your Remote Support URL.
This URL is provided in the BeyondTrust welcome email and includes your site URL followed by /login. - From the left menu, click Dashboards.
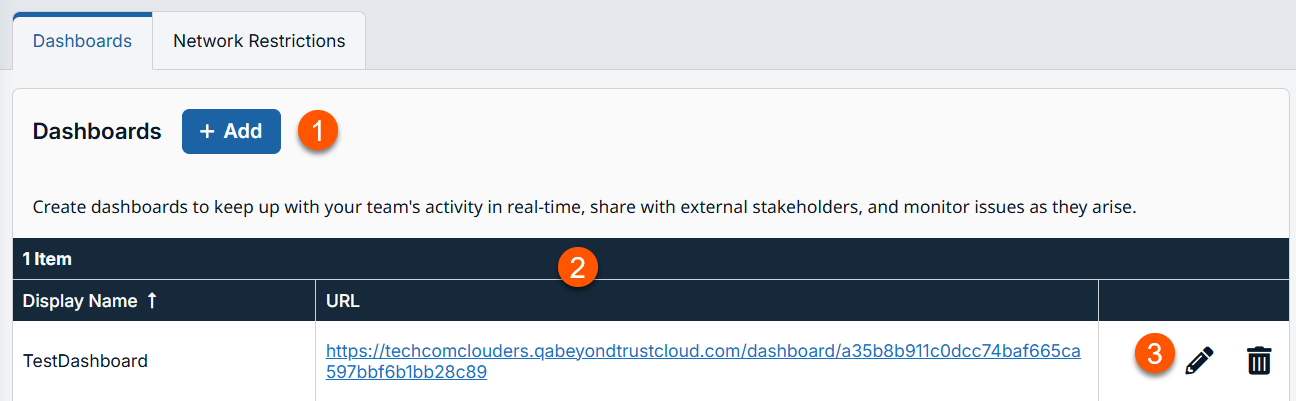
The Dashboards page opens and displays by default. - Click Add.
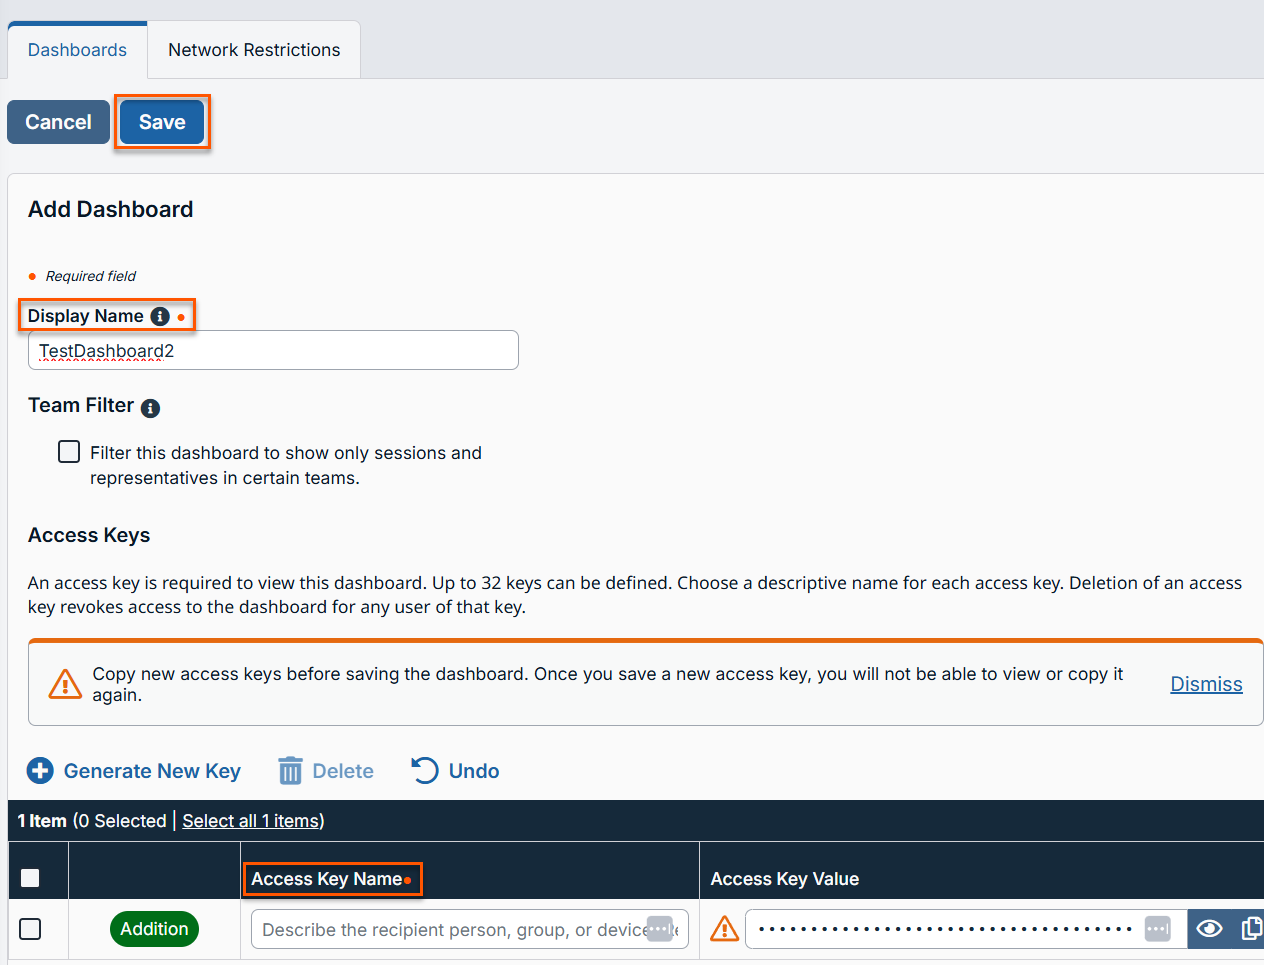
- For Display Name, Create a unique name to identify this dashboard. This name is visible at the top of the dashboard.
- For Team Filter, if no teams are defined for your site, this area is hidden.
- For Access Keys, an access key is required to view this dashboard. A viewer needs to use the key only once to access the dashboard and won't be prompted again unless the access key is revoked or the viewer logs out.
Up to 32 keys can be defined. Depending on your scenario, you may want to give a separate key to each viewer.The field names in the Access Keys table are renamed to Access Key Name and Access Key Value.
- For Generate Key, when you first come to this page, one key has already been generated for you. If you want to create an additional key, click Generate Key. New keys display a green Addition label.
Prior to version 25.2.1, when a dashboard is created an initial key is already generated for you, so there was no need to click Generate Key.
The Generate Key field has been renamed to Generate New Key. This field now generates additional keys.
- Click Save.
Edit a dashboard
- Use a Chromium-based browser to sign in to your Remote Support URL.
This URL is provided in the BeyondTrust welcome email and includes your site URL followed by /login. - From the left menu, click Dashboards.
The Dashboards page opens and displays by default. - From the Dashboard table, select a dashboard.
- Click the pencil to edit.
- Make the necessary changes, click Save.
Delete a dashboard
- Use a Chromium-based browser to sign in to your Remote Support URL.
This URL is provided in the BeyondTrust welcome email and includes your site URL followed by /login. - From the left menu, click Dashboards.
The Dashboards page opens and displays by default. - From the Dashboard table, select a dashboard.
- Click the trash can to delete the dashboard.
- A confirmation dialog box displays, click Yes.
View a dashboard
To view the dashboard, go to the URL listed on the main dashboard page. If you have not been to this dashboard before or if your access key has been revoked, you see a login screen. Paste the access key into the field and click Log In.
At the top right of the dashboard, the dashboard's display name shows. To the right of this is the Main Menu button. Here you can select a color scheme of Light or Dark, or you can switch languages if you have additional languages enabled for your site. You can also log out of the dashboard. If you log out, you will have to re-enter the access key. If you did not save the access key, a new key must be generated.
The top left of the dashboard lists the teams displayed. If multiple teams are associated with this dashboard, a dropdown allows you to filter the view by team. If only one team is associated, its name appears as static text. If no teams are defined for your site, this area is empty.
View the number of current sessions (active and waiting), the number of waiting sessions, and the wait time for the oldest session in queue. Also view how many reps are logged in and how many of those have a status of Available.
In the Reps pane, the detailed view displays a list of logged-in representatives and the number of sessions each currently has, along with a colored bar indicating that they are Available (green), Unavailable (gray), Away or Idle (yellow), or Busy (red). The high-level view shows a pie chart of representative statuses, with the number of active sessions in the middle.
In Today's Session History, view the total number of sessions run, along with the average duration (time measured from customer client launch to close), average handle time (time representatives spent in session), and average wait time (time customers waited before a representative joined the session). Also view the number and percentage of abandoned sessions (the customer, not the rep, ended the session) and the average abandon time (how long the customer stayed before ending the session).
Clicking the Details button shows a list of all sessions, including the start and end times, the customer name, and the company name. Click the Full Screen icon to expand this view or the Minimize icon to return. Clicking the session ID (LSID) takes you to the session details report in the administrative interface. Login is required to see the session details report.
Today's Rep History displays a list of all representatives logged in today, the number of sessions each ran, and the total and average duration of sessions.
Clicking the Details button shows a list of all sessions run by this rep, including the start and end times, the customer name, and the company name. Click the Full Screen icon to expand this view or the Minimize icon to return. Clicking the session ID (LSID) takes you to the session details report in the administrative interface. Login is required to see the session details report.
The Sessions pane shows a list of active sessions with details for time in queue (how long the session has been assigned to a specific support team), total time (how long the customer client has been connected), a list of reps who have joined the session, the customer's name and company, the session start method, and the selected issue. Available data varies based on how the session was started.
Updated about 8 hours ago