Permissions | Entitle Pathfinder
Overview
The Permissions screen in Entitle is where customers can map out users’ behaviors using the Permissions graph, as well as view and manage their organization’s permissions using the table view. It provides a unified view of users based on permissions granted to different application integrations.
The permissions screen has several main functionalities:
- View permissions using the graph view (default): The permissions graph allows Entitle’s customers to make sure their users have just enough access to different integrations, and to identify overprivileged or unknown identities, unwanted permission chains, or toxic combinations of permissions visibly.
- View and manage your organization’s permissions using the table view.
Permissions graph and table sync mechanism
- Any logical filter applied in the table will be reflected in the graph:
- Filters using "is" logic in the permissions table will display in the graph view.
- Filters using "is not" logic or empty users cannot be displayed in the graph.
- Any filter applied in the graph view is reflected in the table view, except for the risk and sensitivity indicators.
Definitions of key concepts
-
User: An entity that can receive, hold, and have permissions revoked.
-
Account: The identity through which a user accesses systems and resources and to which permissions are assigned.
-
Integration: A configured connection between Entitle and another application. It includes all required setup details, such as credentials and user permissions.
-
Resource type: A category of resource supported by a specific integration, varying by integration.
-
Resource: An entity within an integration to which a user can gain access via permission (for example, a group of users, a project, or a team).
-
Role: A level of access a user can hold for a resource, such as Read or Admin.
-
Permission path:
-
Direct access: The user has direct (JIT or Just-In-Time) permission to the resource.
-
Indirect access: A selection of roles assigned to the user are granted by different role, rather than by direct assignment.
-
-
Permission type:
-
External: Permission granted to an account externally, not managed by Entitle.
-
JIT request: Permission granted through Entitle’s access request process.
-
Birthright policy: A policy that grants default permissions to users who are part of it.
Even if a policy is defined for a single user, other users who share the same account are also granted the permissions.
-
-
Created: The date the permission was created.
-
Expiration: The date the permission will expire.
The permissions graph
- Sign in to app.beyondtrust.io with your credentials. The BeyondTrust Pathfinder Home displays.
- At the top right of the page, select your site from the drop-down.
- Select the Entitle tile from your list of available applications.
- From the top left menu, select Permissions.
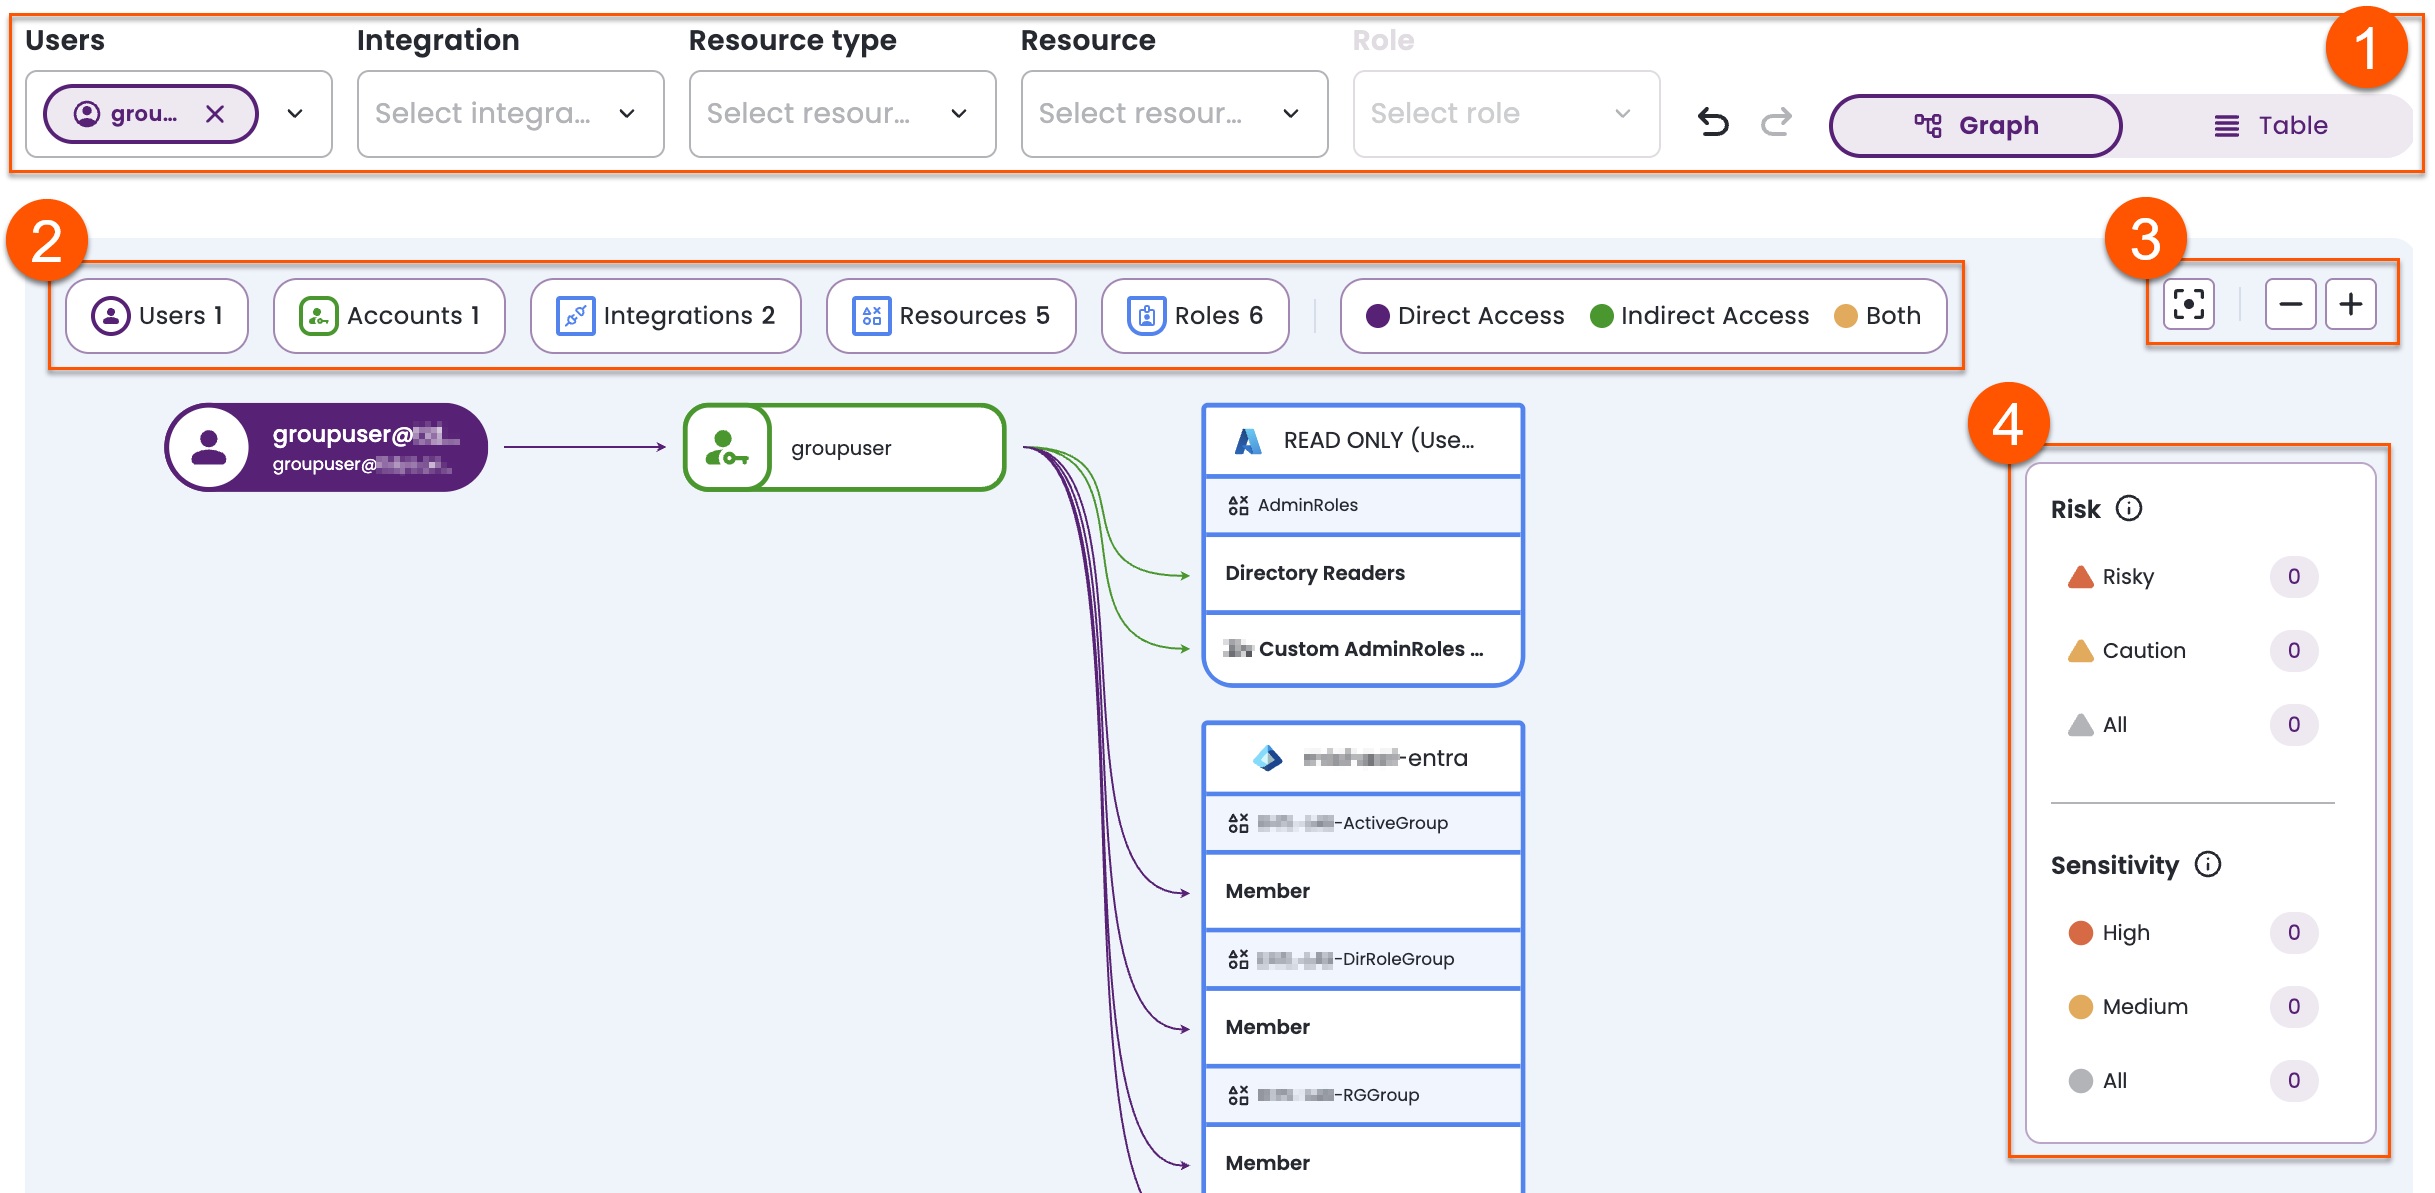
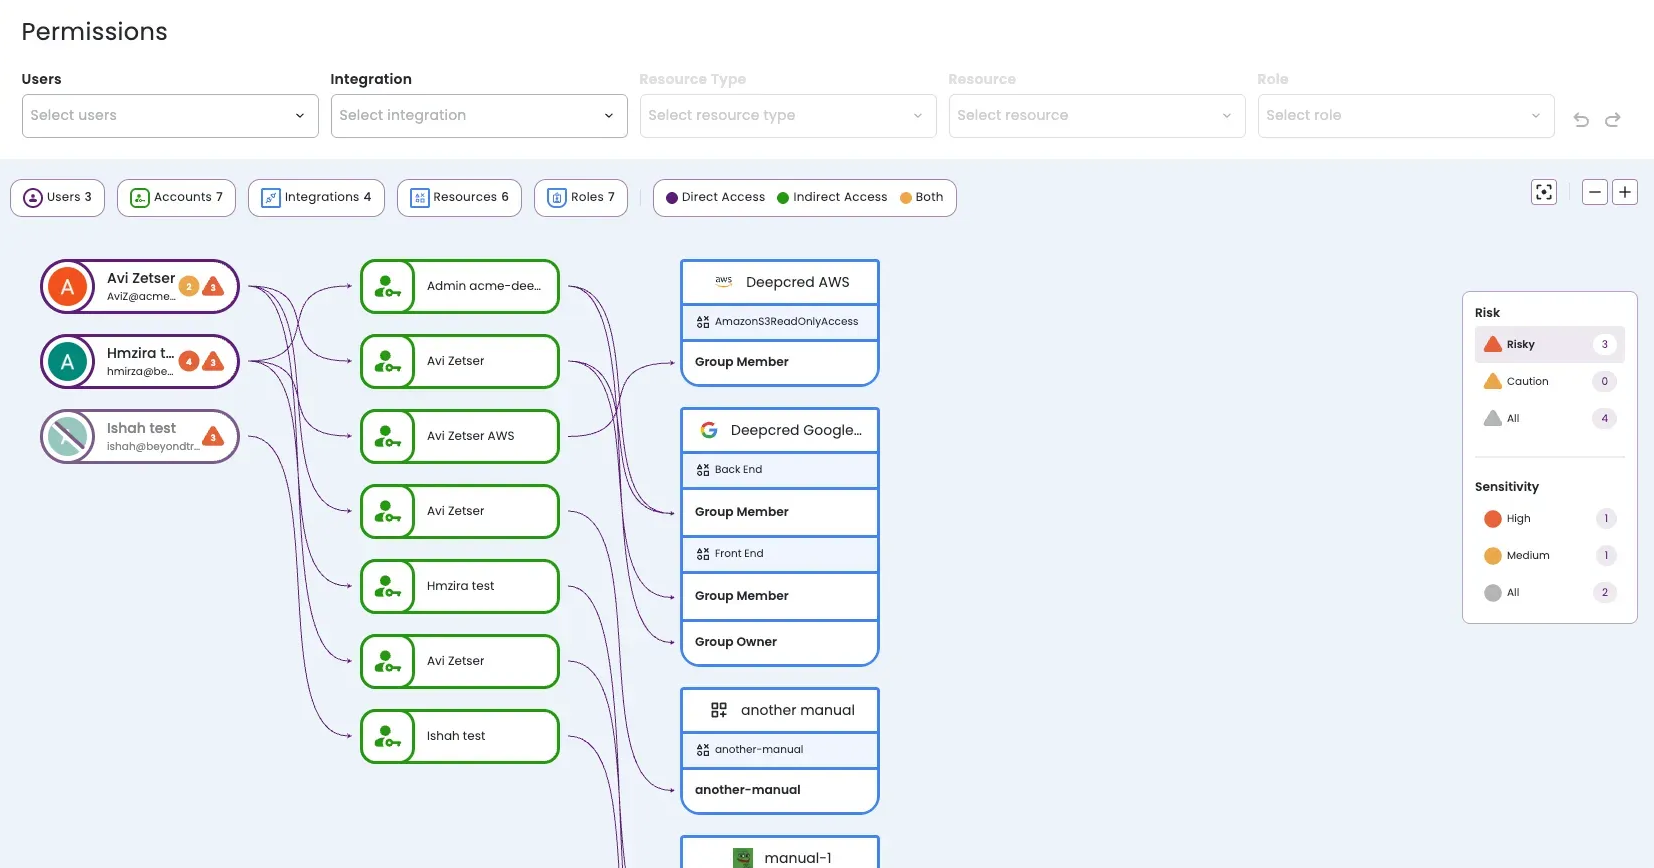
You will see four main sections:
-
Filters menu:
-
User: An entity that can receive, hold, and have permissions revoked.
-
Integration: A configured connection between Entitle and another application. It includes all required setup details, such as credentials and user permissions.
-
Resource type: A category of resource supported by a specific integration, varying by integration.
-
Resource: An entity within an integration to which a user can gain access via permission (for example, a group of users, a project, or a team).
-
Role: A level of access a user can hold for a resource, such as Read or Admin.
You must select a resource before selecting a role.
Each of the aforementioned filters is a multi-select option, and any combination of selections can be made at any time.
-
-
Graph key: Shows the total number of users, accounts, integrations, resources, and roles discovered by the selected filters. Permission paths are indicated by colored lines: direct access (purple), indirect (green), and both (yellow).
-
Permissions graph functionalities: Controls for interacting with the permissions graph, from left to right: return to center
 , zoom out
  , and zoom in
  .
.
- Risk and sensitivity indicators (Insights): Visual markers that highlight users, accounts, or resources associated with elevated risk or sensitivity levels, helping to identify potential security concerns.
This is available only on Entitle on Pathfinder and only if an integration has been established with BeyondTrust Identity Security Insights.
For more information, see Risk and sensitivity indicators.
If you would like to reverse any actions in the graph, click undo
or redo
on the right side of the filter menu.
The permissions table
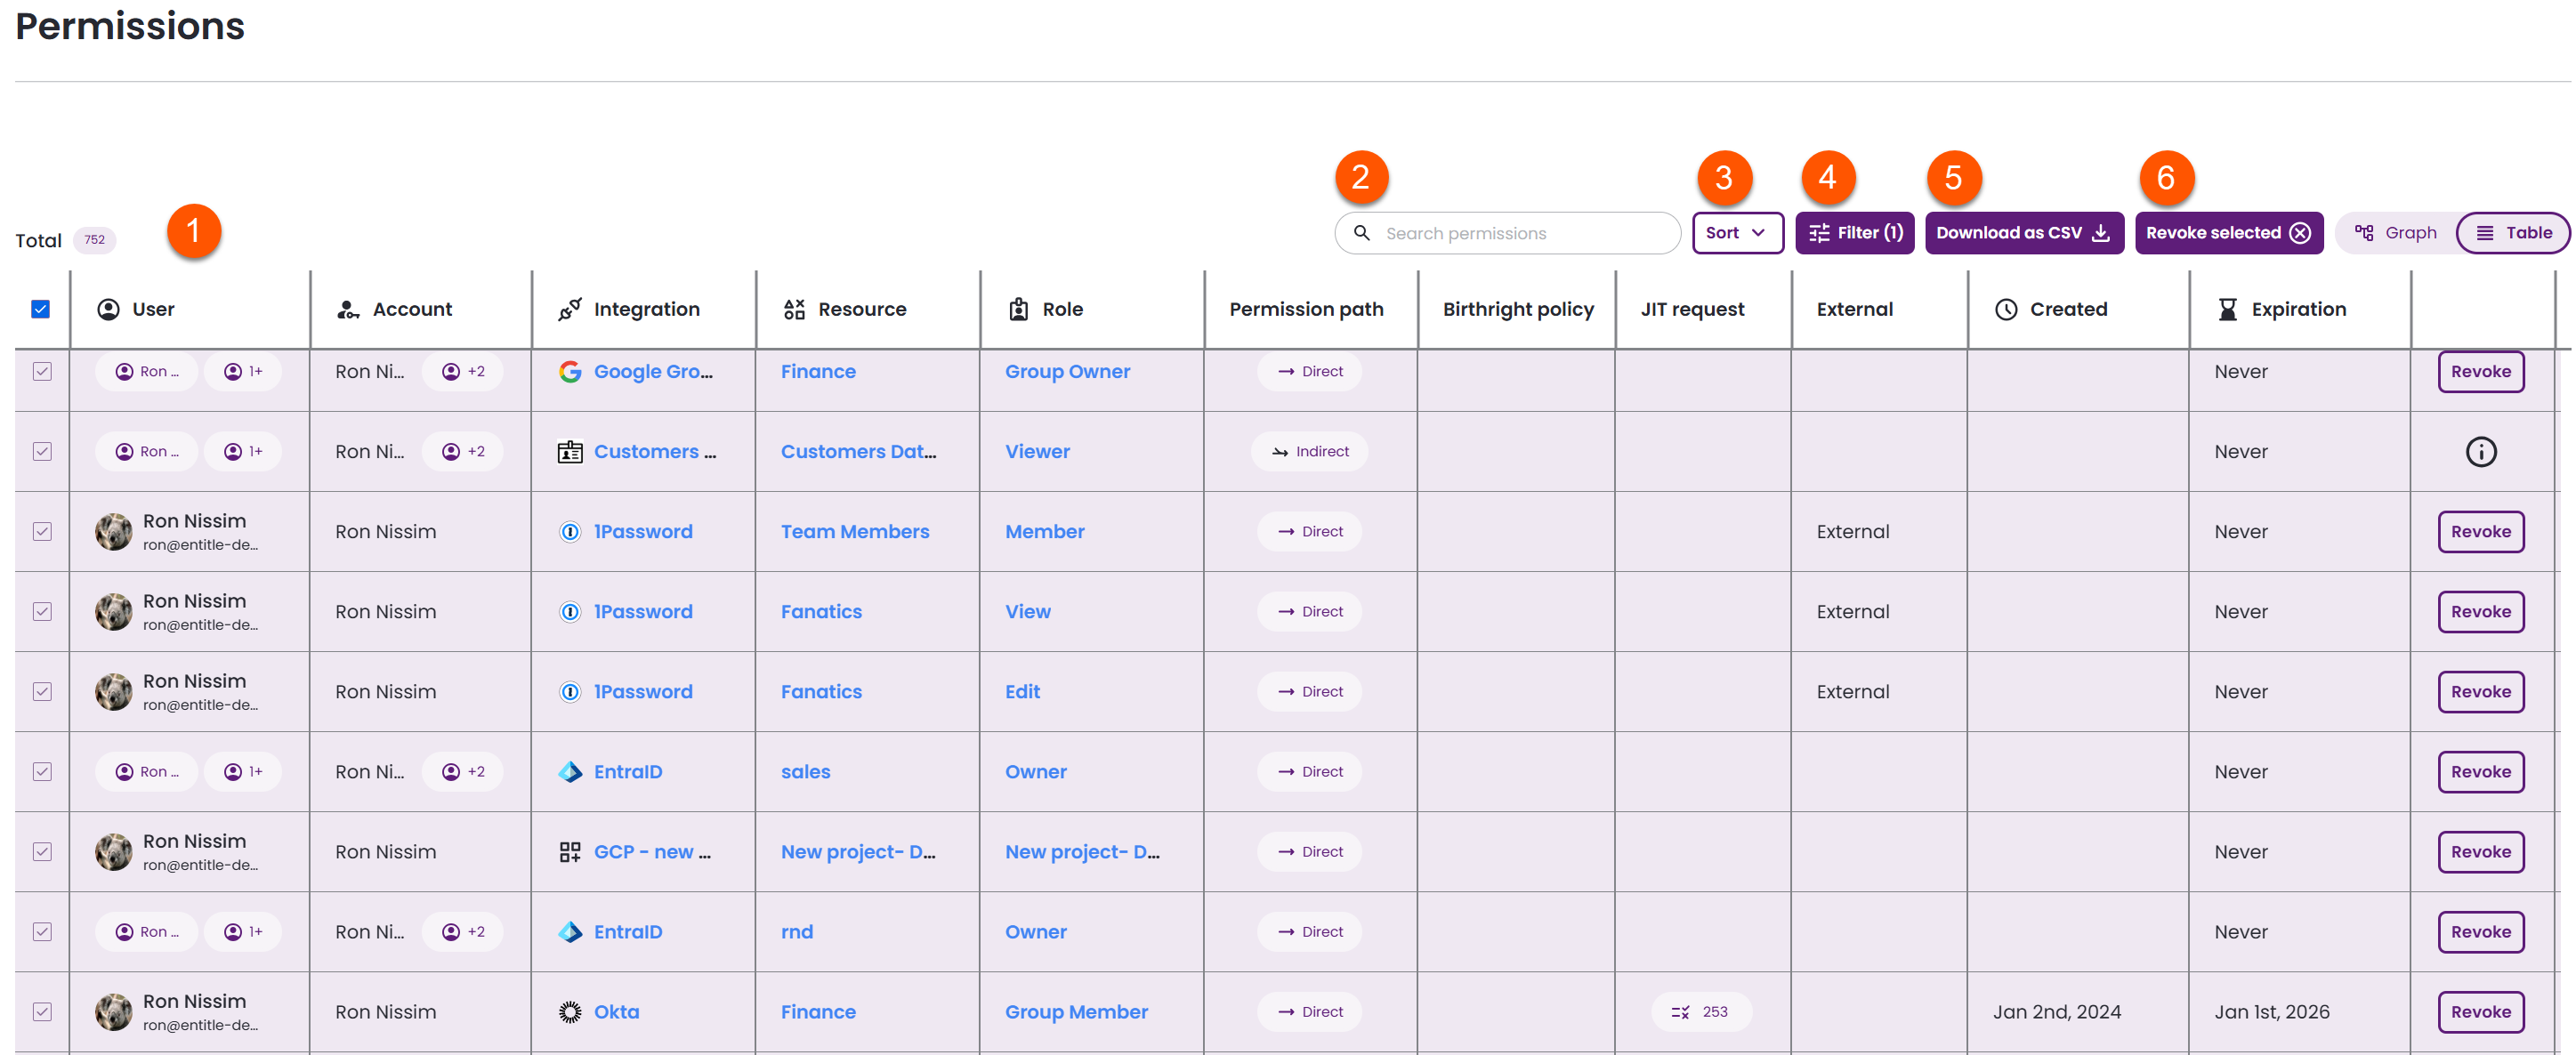
This view has multiple functionalities for admins:
-
View permissions in a table format, according to the following parameters:
- User
Select Empty users to include permissions with no assigned user in the filter results.
- Account
- Integration
- Resource type
- Resource
- Permission path
If a permission with a permission path of Direct & Indirect (both) is revoked, the direct (JIT) access will be revoked and the indirect will not.
- Permission type
- Created
- Expiration
The Expiration filter supports predefined date ranges, custom date ranges, and a Never option. Select Never to display permissions that never expire.
The Created and Expiration table columns update dynamically based on all factors that grant the permission.
- User
-
Search permissions: Find accounts, resource names, and role names that match your search query.
-
Sort: Select a parameter to sort the table, then select it again to toggle between ascending and descending.
-
Filter: Select one or more filters to determine which data is displayed.
-
Download as CSV: To download specific rows, select the checkboxes on the left; otherwise, the entire table will be downloaded.
-
Revoke selected: Select specific rows using their checkboxes to revoke permissions for the associated users.
Revoke permissions
There are two ways to revoke access to selected permissions using the permissions table.
Single-permission revocation
Using the Revoke button in a specific permission row allows you to directly revoke that individual permission. In addition to the Revoke button, the column includes several other indicators:
- "i" tooltip: Indicates that indirect permissions cannot be revoked.
- "!" tooltip: Indicates that revoking a permission granted via a birthright policy is a temporary action. Permissions will be reassigned during the next sync
- An empty field indicates that the specific permission is associated with an unmanaged account and therefore cannot be revoked.
Bulk revocation
The Revoke selected button allows you to revoke permissions in bulk. You must have at least one eligible permission selected, up to the entire table.
- Eligible permissions are any that are not indirect or unmanaged.
- If no rows are selected, the button is disabled.
During the Revoke selected process, you may see the following screens, designed to help you review and confirm the impact of revoking selected permissions:
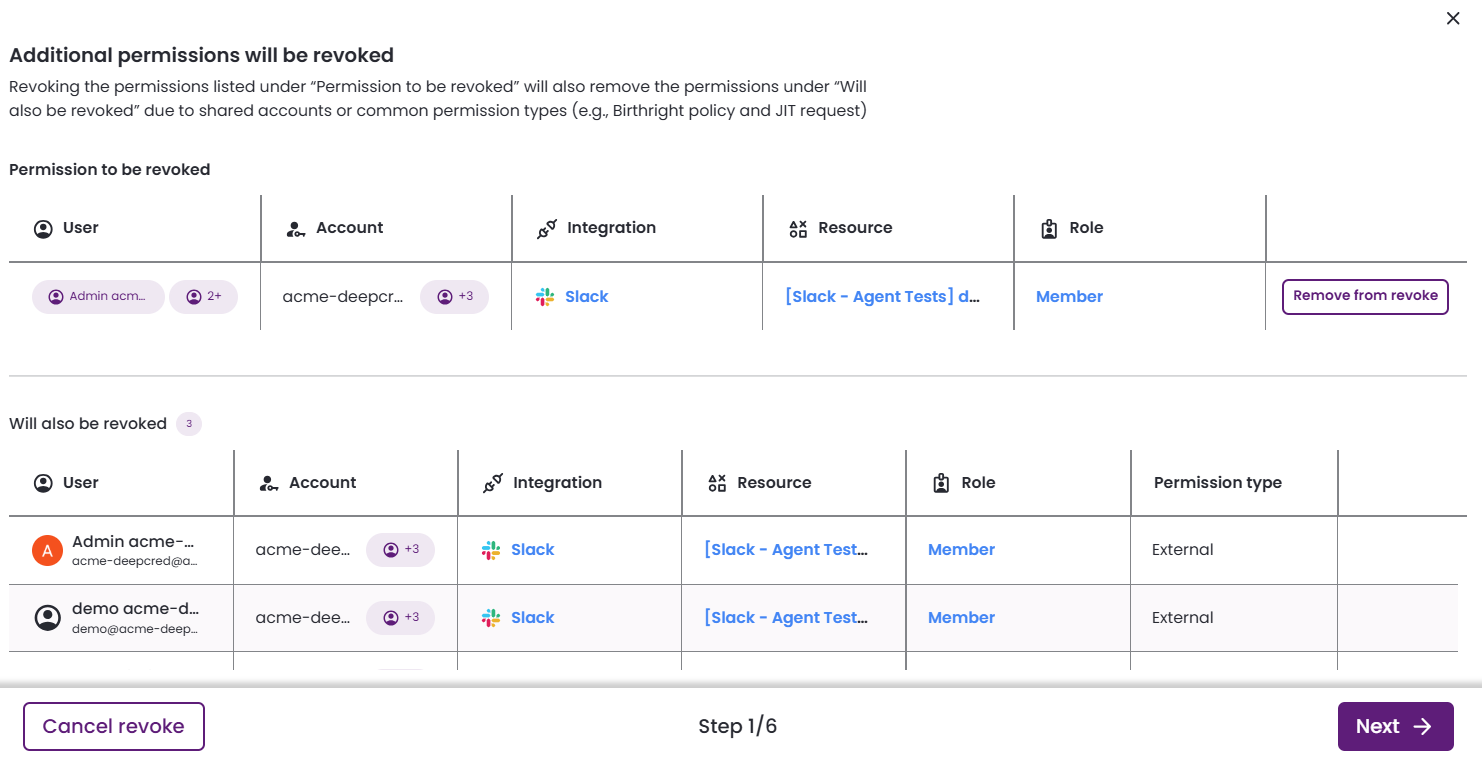
-
Additional permissions will be revoked
Presents the selected permissions and the additional permissions that will be revoked due to shared accounts of a common permission type (birthright policies, JIT requests, etc.)
Revoking a permission from a shared account impacts all users who share that account.
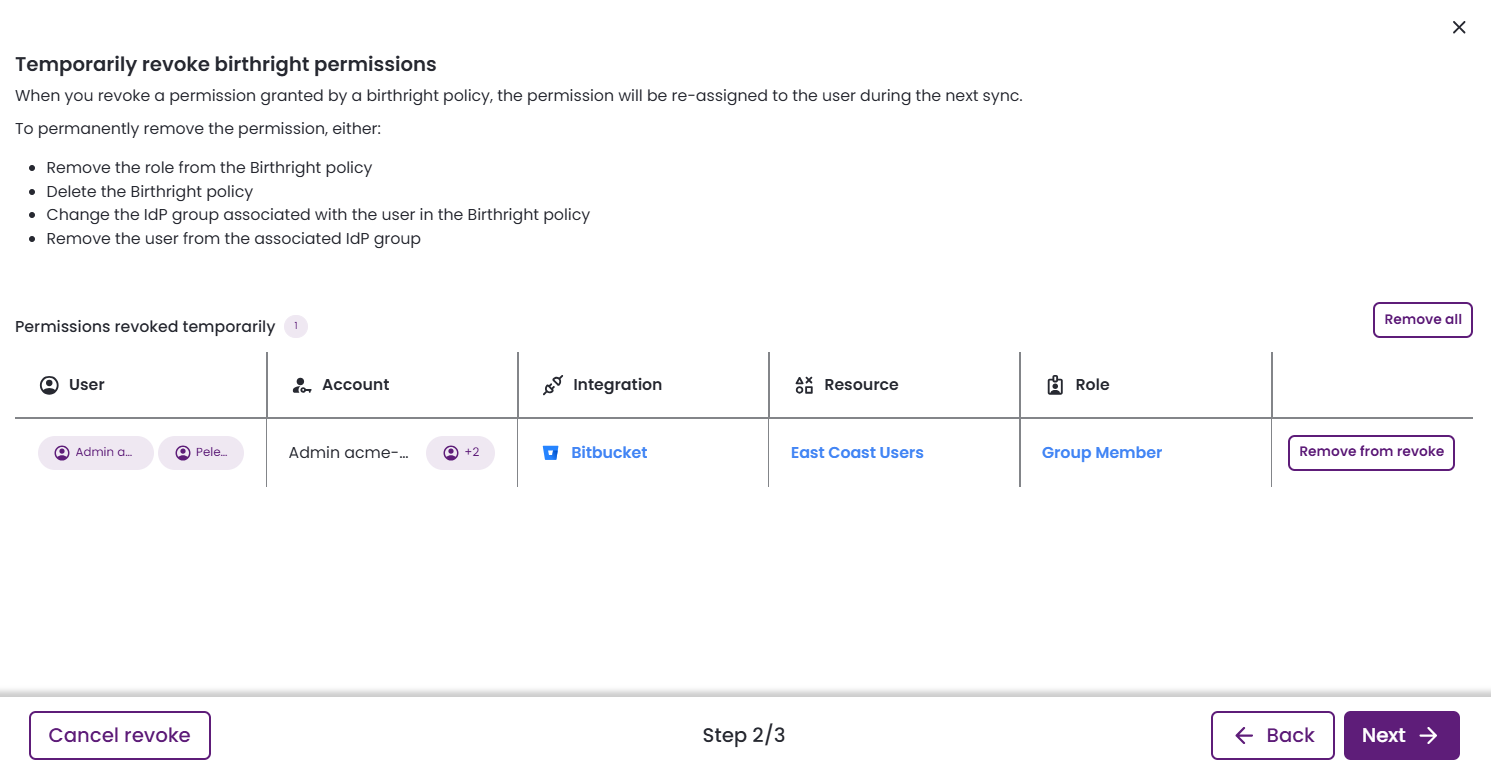
-
Temporarily revoke birthright permissions
This screen appears when the selected permissions for revocation were originally granted by a birthright policy, indicating the action is temporary.
-
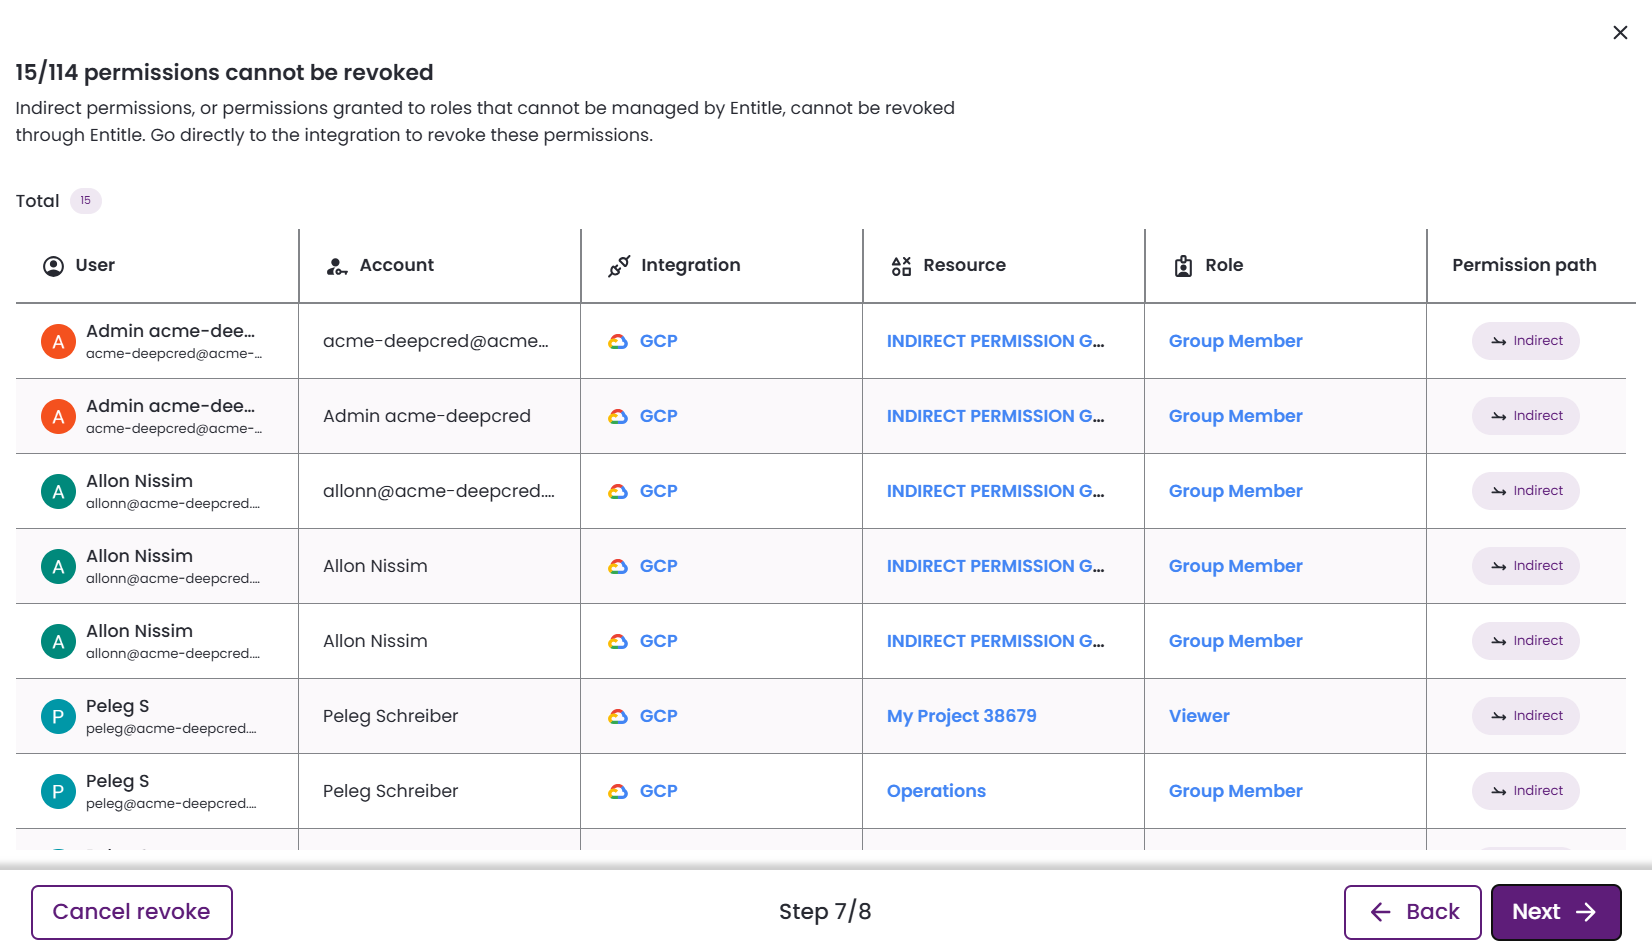
Permissions cannot be revoked
This screen lists permissions that cannot be revoked automatically. These permissions are either indirect or unmanaged.
-
Revoke permissions?
This screen is your final opportunity to review and confirm the permissions selected for revocation. Click Revoke permissions to complete the action.
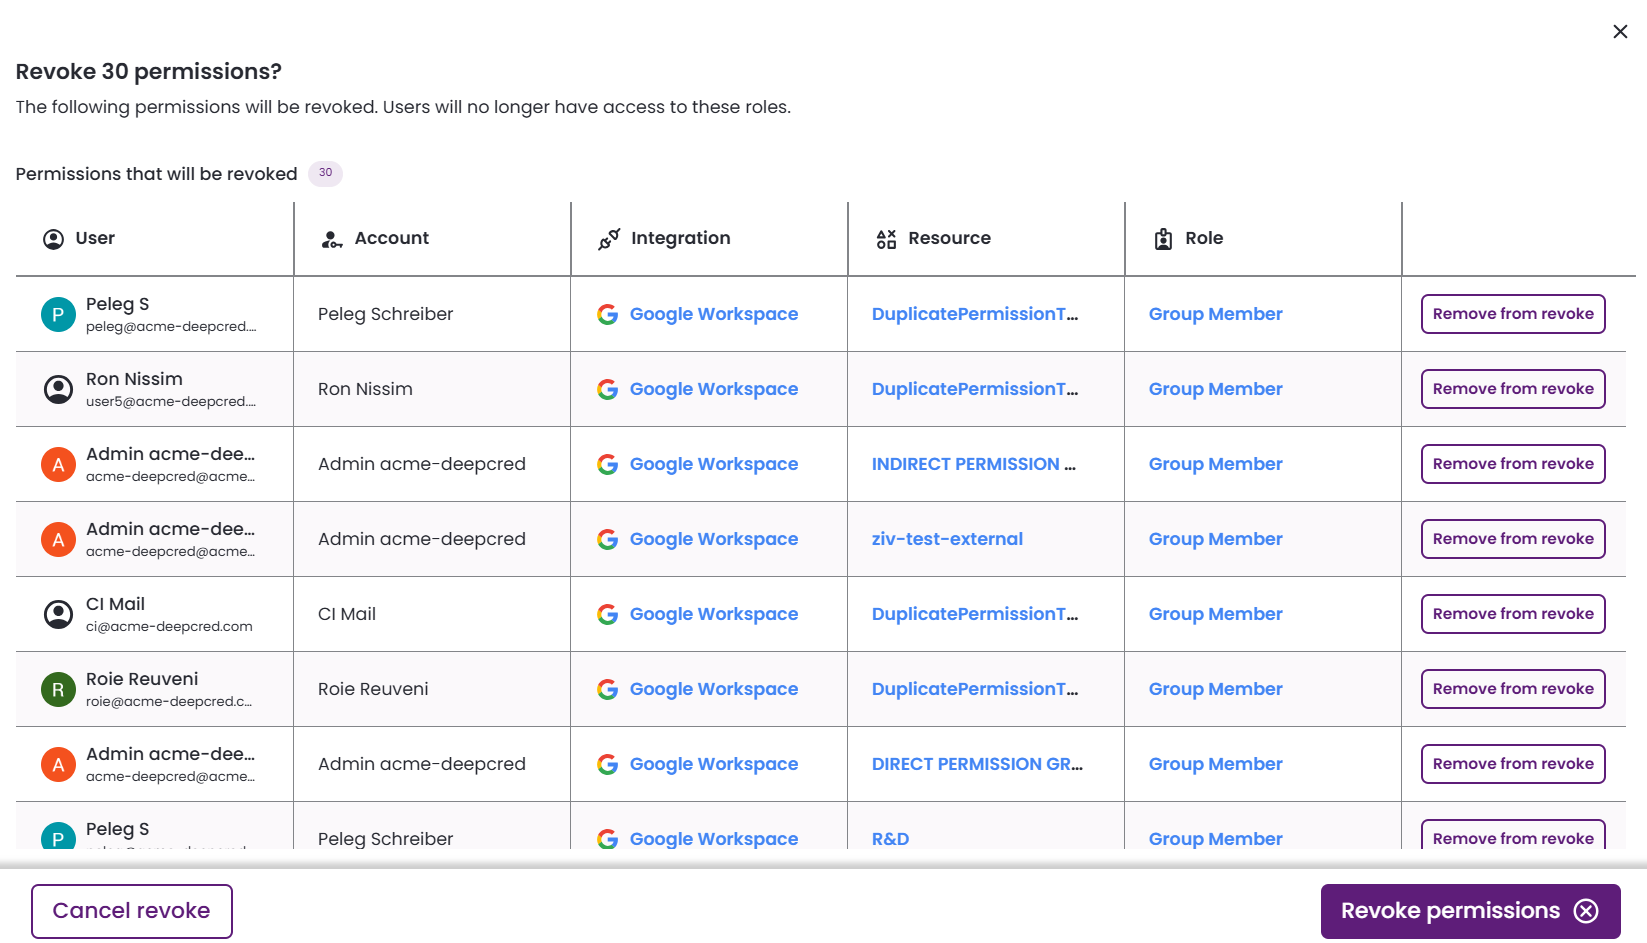
Across all revocation screens, you can perform the following actions:
- Remove from revoke: Exclude a single permission from being revoked.
- Remove all: Removes all permissions listed in the current table from the revocation process.
- Next: Continue to the next step in the revocation process.
- Cancel revoke: Exit the workflow without making any changes.
Risk and sensitivity indicators
Important informationRisk and sensitivity indications are visible in Entitle only if accessed through Pathfinder, with a user who has admin privileges in both Entitle and Identity Security Insights.
See the Identity Security Insights integration guide to set up risk and sensitivity indications in Entitle.
Currently, this functionality is supported only in the permissions graph and does not display in the permissions table.
View risk/sensitivity indicators using the Permissions graph
-
Once the prerequisites are met, the Insights Risk and Sensitivity filters appear at the right of the permissions graph, even before any filters are selected. This lets you immediately see the status of employees, such as who holds multiple high-risk permissions.
-
Once filters have been selected, the graph displays the users according to the selected filters.
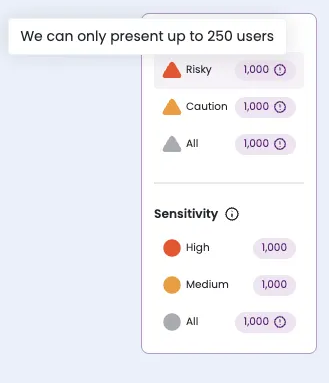
If only one risk or sensitivity filter is selected, and no other filters (Users, Integration, Resource type, Resource, or Role) are applied, the permissions graph will display a maximum of 250 users. The following tooltip appears:
Filter risk and sensitivity indicators
Admins can filter users based on risk and/or sensitivity levels. To apply the filters:
- Use the appropriate filter to select the users, resources, or roles whose permissions you want to display.
- In the right-hand Risk and Sensitivity filters, a number shows the cumulative risk and sensitivity levels for all users currently displayed in the graph.
- Use these filters to update the graph based on the risk and sensitivity information you want to see.
View detection details in Insights
-
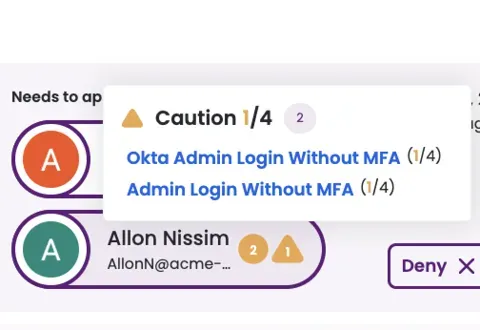
For any user with a risk or sensitivity icon, hover over the icon to see a summary of their risk and sensitivity details. In the example below, the cumulative risk level is 1 out of 4.
-
Clicking on a detection redirects you to Insights, where you can view more detailed information about the specific detection.