Microsoft Sentinel | Entitle
Set up Audit Logs Webhooks
The following steps are required to connect your Microsoft Sentinel instance to Entitle.
Prerequisites
- The required permissions in the BeyondTrust Product to configure the integration are:
- Access to an Entitle tenant.
- Admin permissions in the Entitle tenant.
- The required permissions and access levels in Microsoft Azure to configure the integration are:
- Access to a Microsoft Azure tenant with an Azure Sentinel subscription.
- A user account with sufficient privileges to create a Logic App and a Microsoft Sentinel Log Analytics Workspace.
- To create a new Logic App, refer to this guide.
- To create a Log Analytics Workspace, refer to this guide.
Stage 1: Configure a Logic App in Microsoft Sentinel
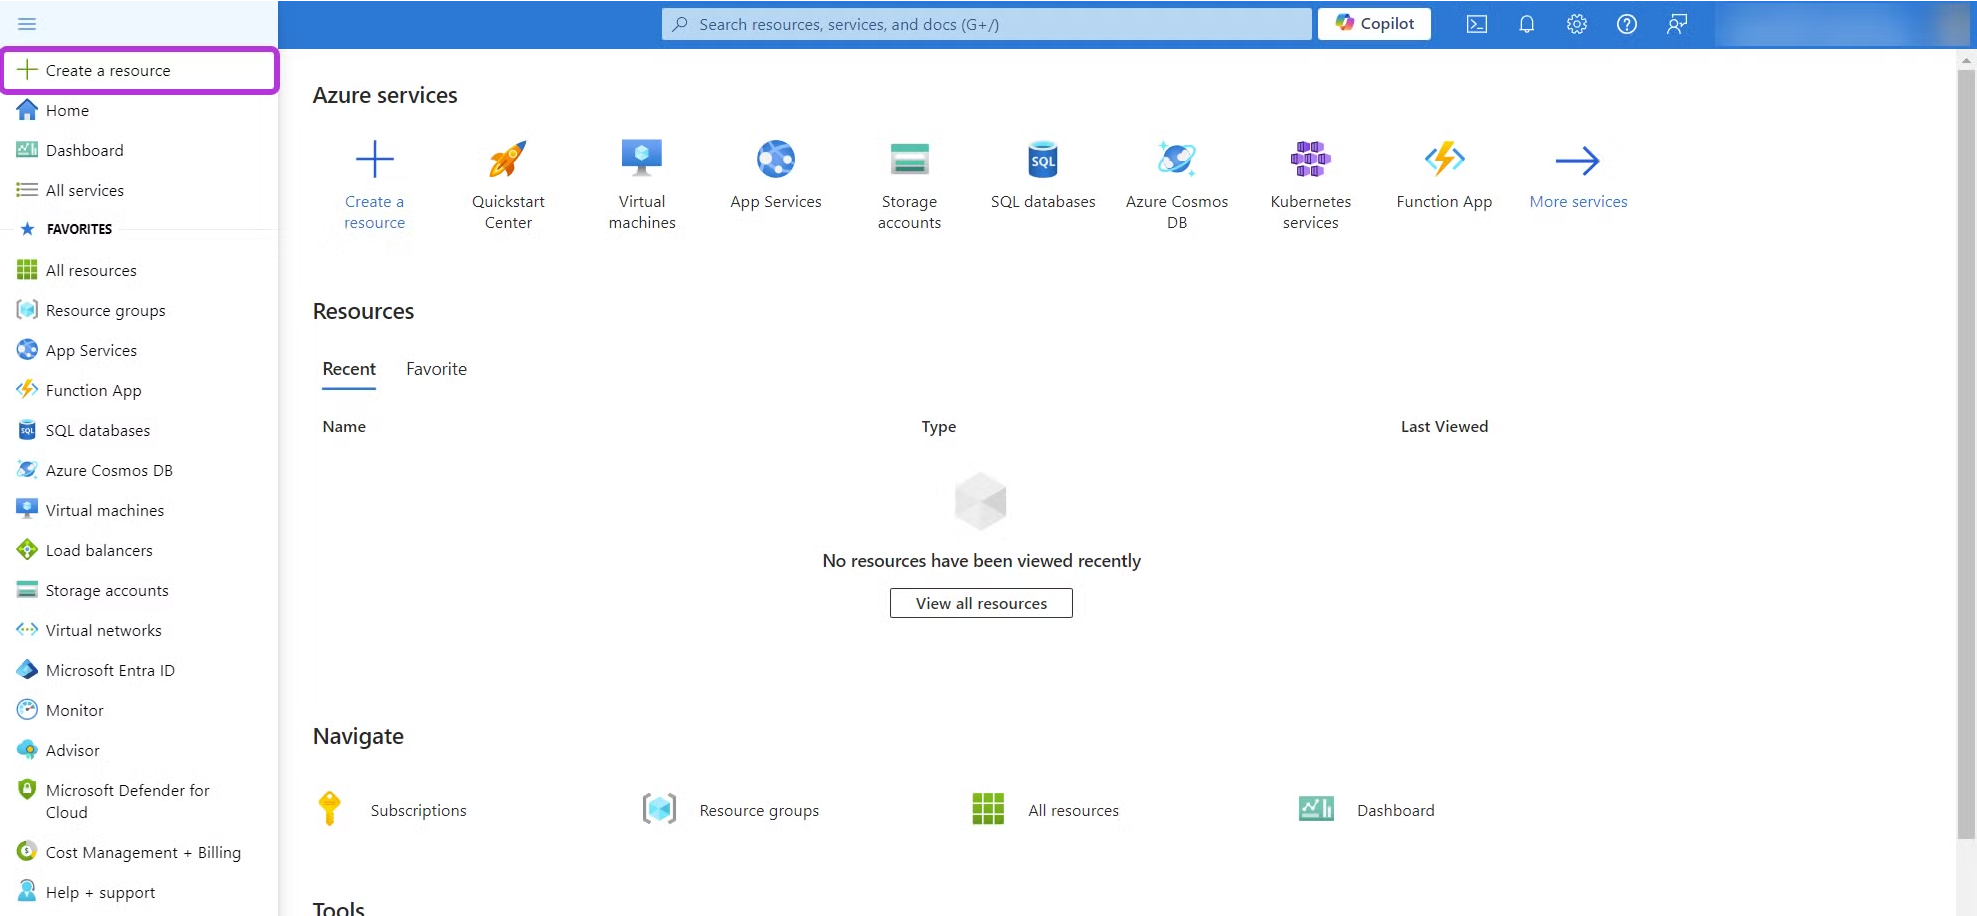
- Log in to the Azure Portal and select Create a resource from the left-side navigation menu.
-
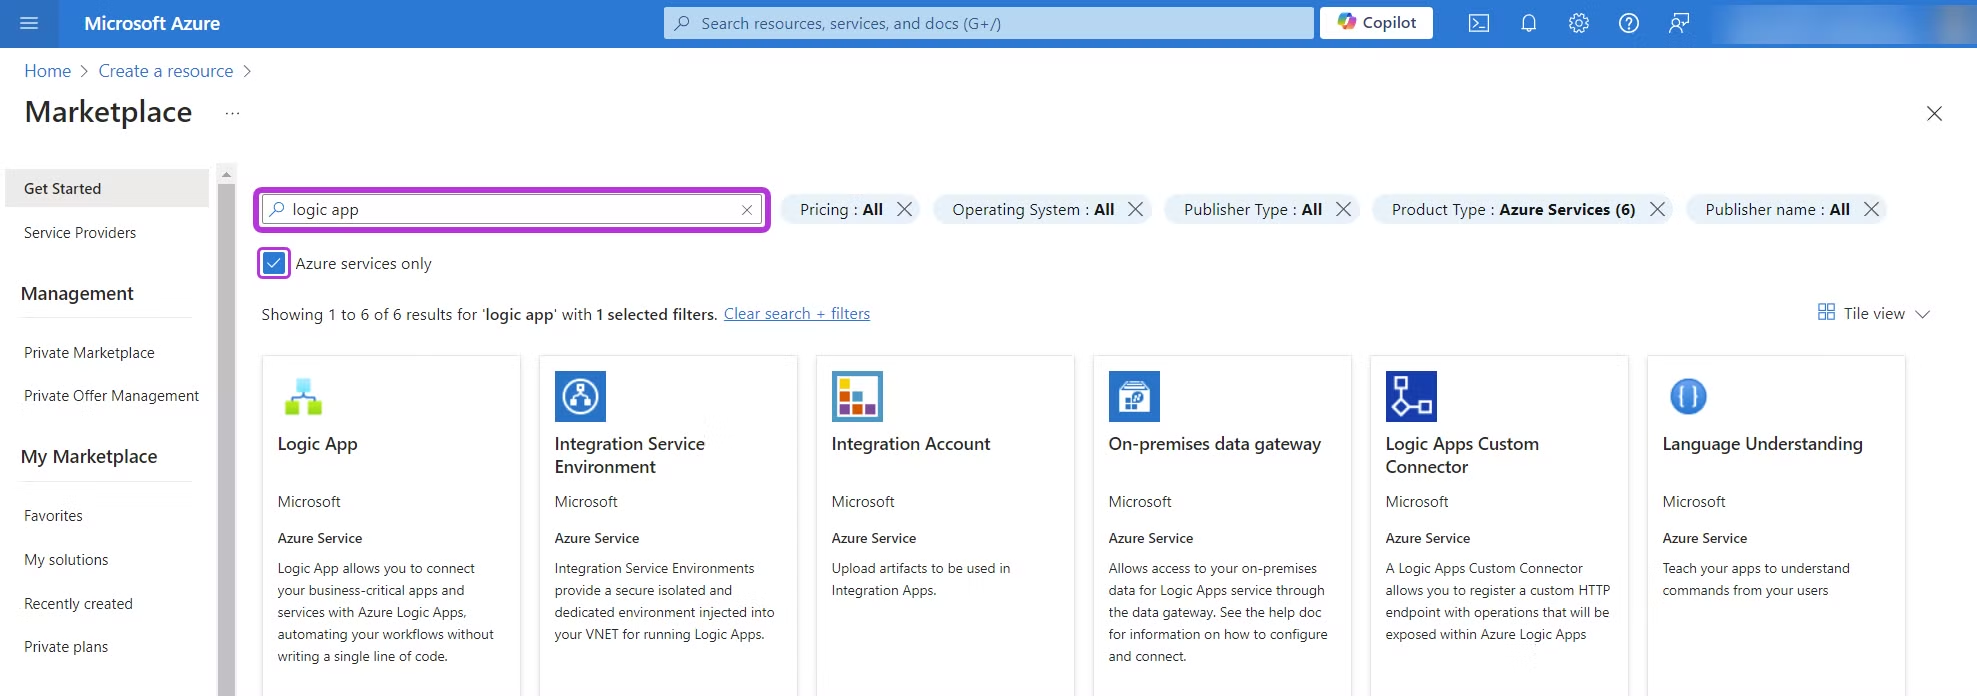
Search for Logic App in the search bar and tick the Azure services only option to simplify the results. Press the Enter key when you are done.
-
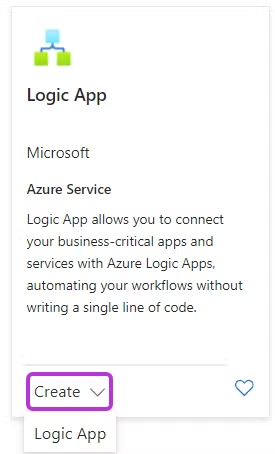
On the Logic App item, click Create, then select the Logic App option from the dropdown menu.
-
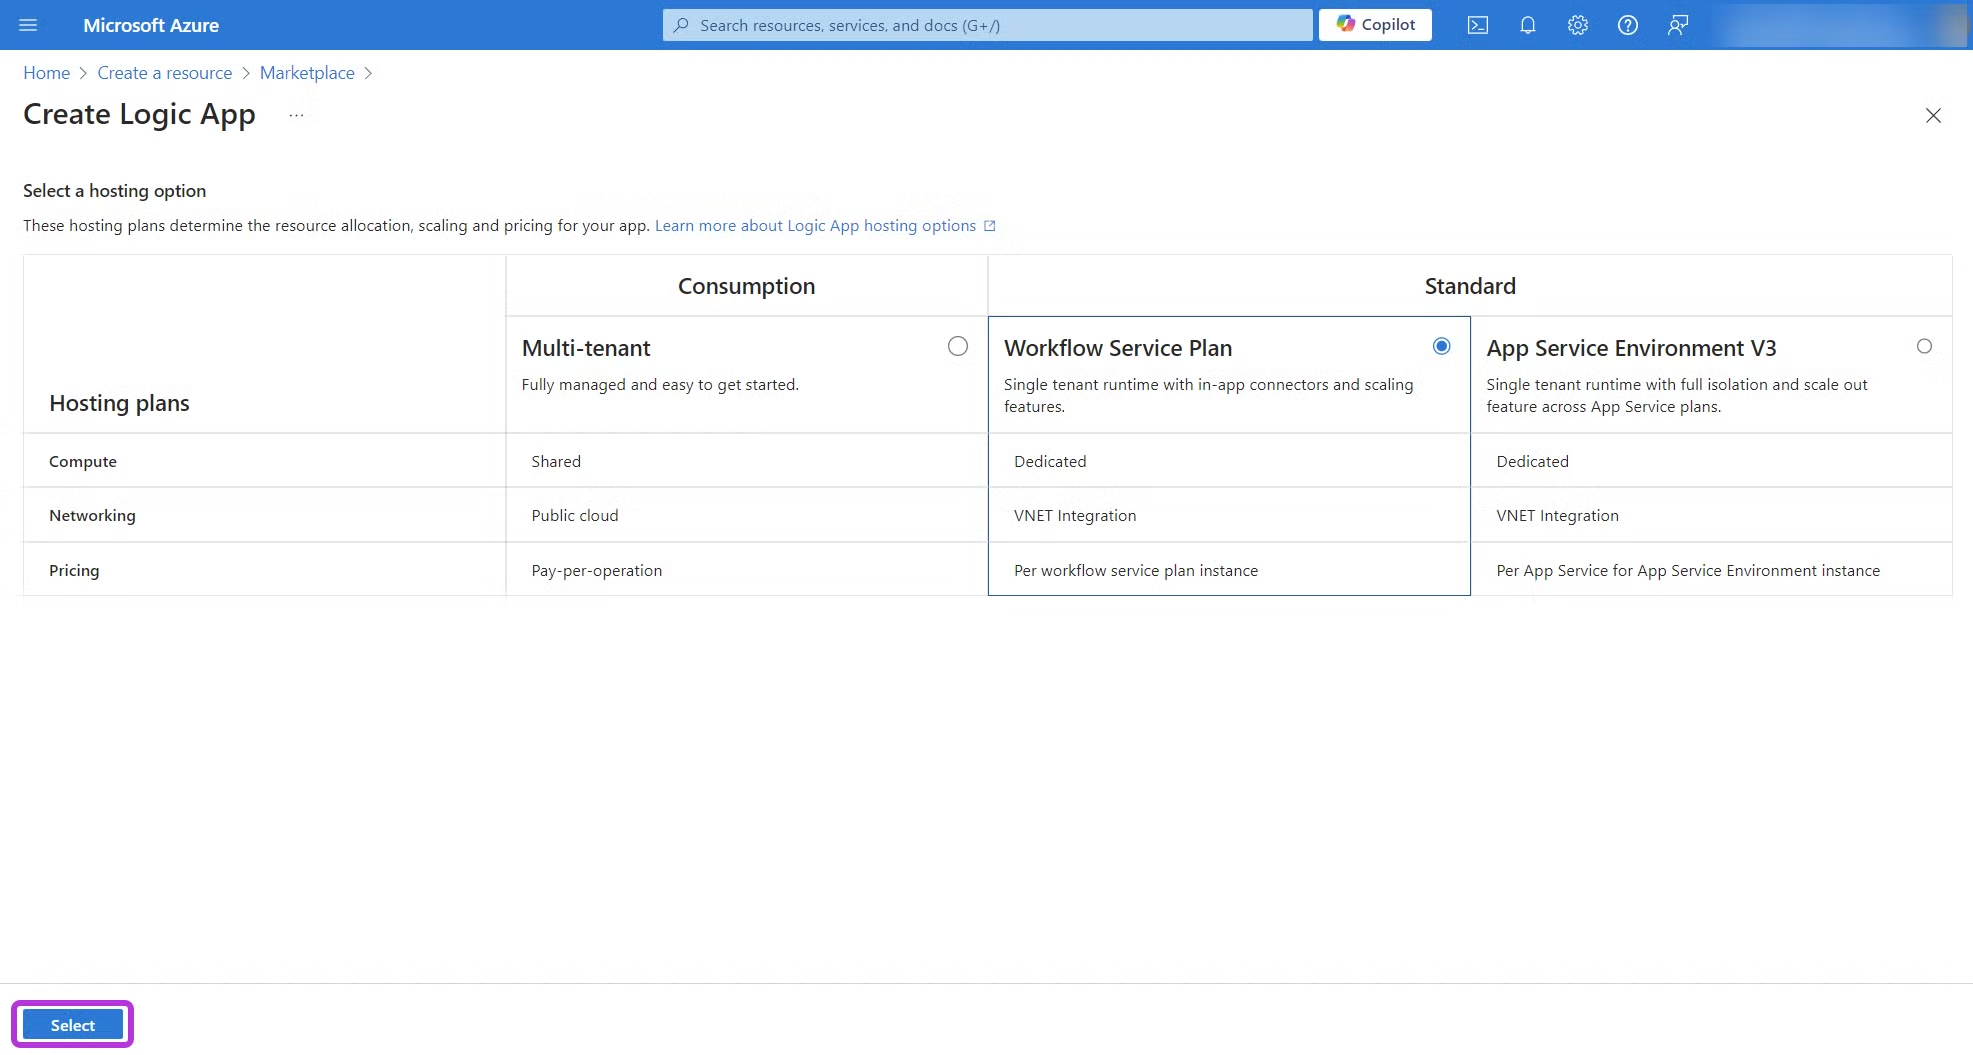
Select a hosting plan from the three available options on the new screen. The default Workflow Service Plan under the Standard hosting options section is suitable unless your organization requires an alternative. After selecting, click the Select button in the bottom-left corner.
-
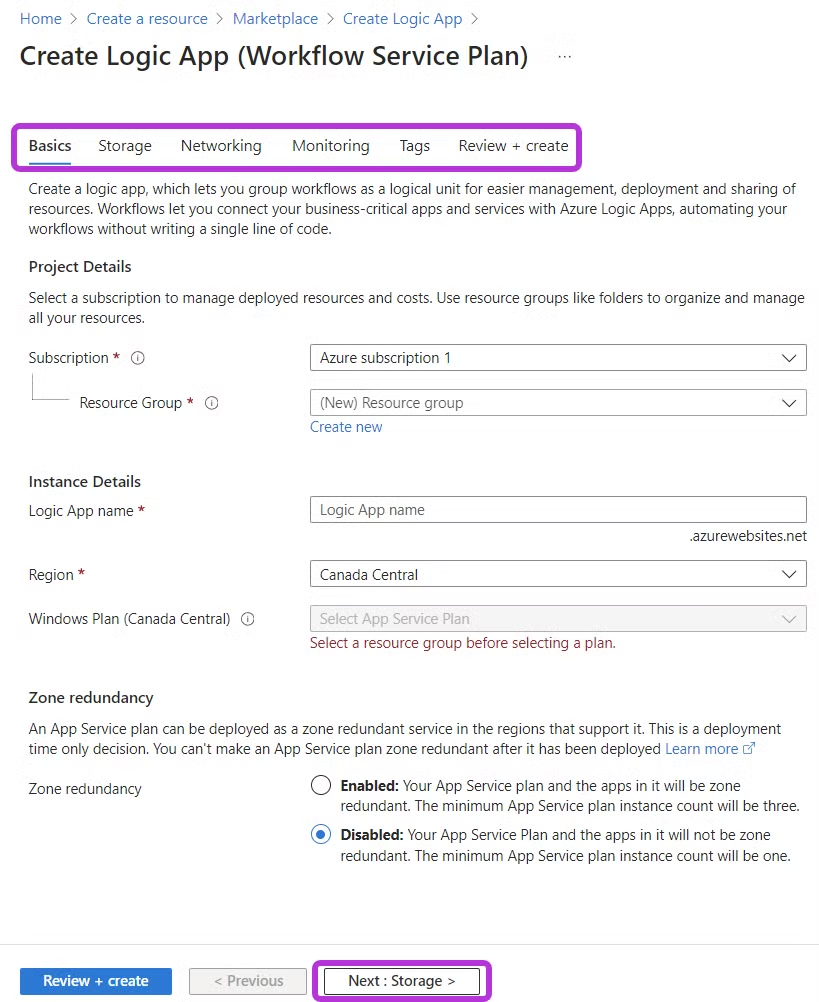
Complete the Create Logic App process according to your requirements by navigating through the different sections: Basics, Storage, Networking, Monitoring, Tags, and Review + create, which is the final step. Keep in mind that the creation process may take a few minutes.
The default choices in each section are sufficient for this integration.
-
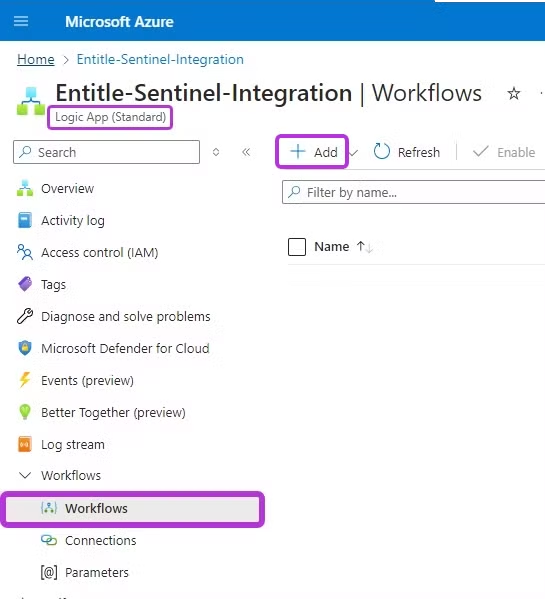
Select the Logic App item (identified by the Logic App (Standard) entry in the Type column) from your Resources group.

-
Select Workflows from the left-side menu. Then, click Add and choose Add again.
-
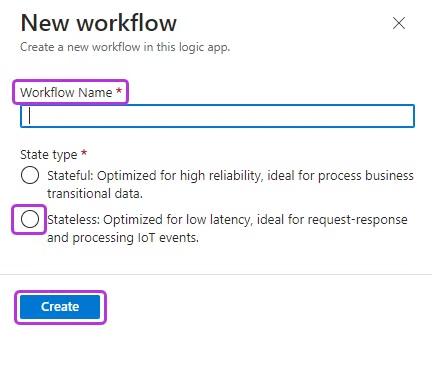
Provide a name for the workflow (e.g., Inbound-Webhook) and select the Stateless option in the State type section. Finally, click Create.
-
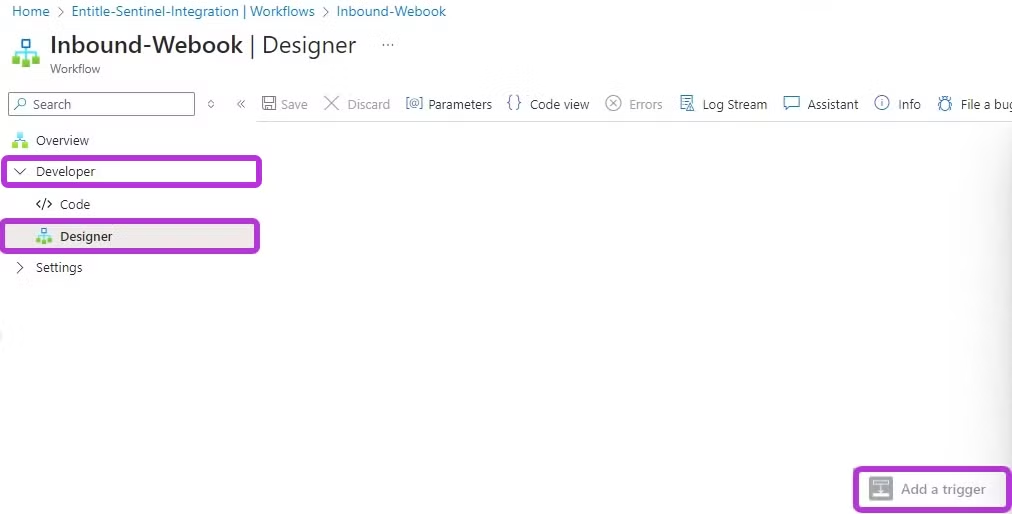
Select your newly created Workflow, expand the Developer menu, and select Designer. Then, click the Add a trigger button in the center of the screen.
-
In the Add a trigger fly-out menu, search for HTTP Request,, and select the When an HTTP request is received item.
-
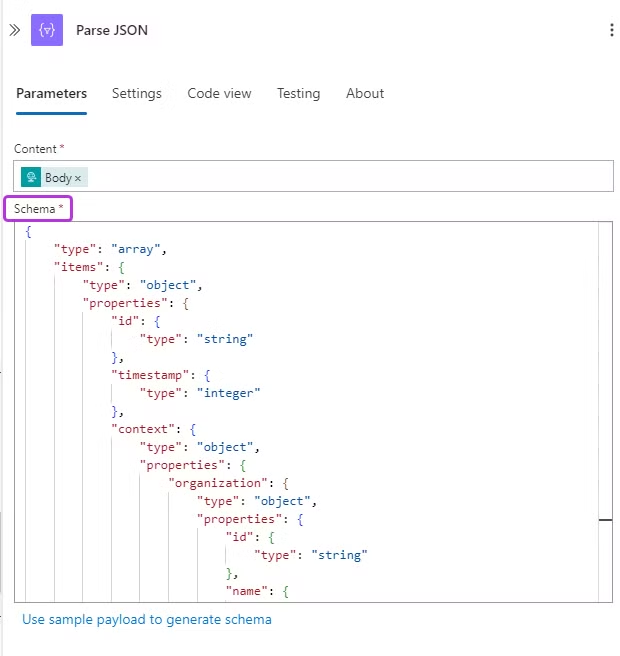
Paste the JSON schema into the Request Body JSON Schema field in the new side-screen.
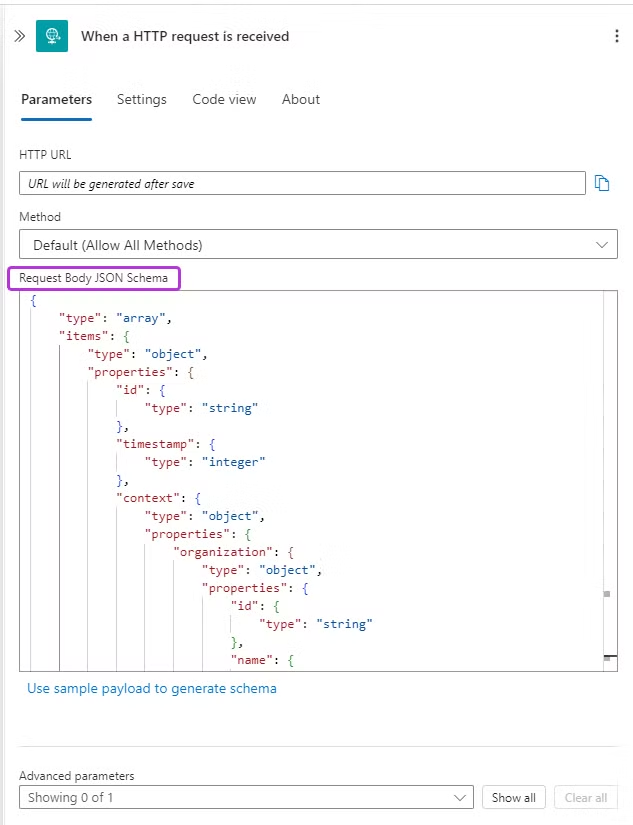
Here is the schema value:
{
    "type": "array",
    "items": {
        "type": "object",
        "properties": {
            "id": {
                "type": "string"
            },
            "timestamp": {
                "type": "integer"
            },
            "context": {
                "type": "object",
                "properties": {
                    "organization": {
                        "type": "object",
                        "properties": {
                            "id": {
                                "type": "string"
                            },
                            "name": {
                                "type": "string"
                            }
                        },
                        "required": ["id", "name"]
                    }
                },
                "required": ["organization"]
            },
            "data": {
                "type": "object"
            },
            "actor": {
                "anyOf": [{
                        "type": "null"
                    }, {
                        "type": "object",
                        "properties": {
                            "type": {
                                "type": "string"
                            },
                            "user": {
                                "type": "object",
                                "properties": {
                                    "id": {
                                        "type": "string"
                                    },
                                    "email": {
                                        "type": "string"
                                    },
                                    "name": {
                                        "type": "string"
                                    }
                                },
                                "required": ["id", "email", "name"]
                            }
                        },
                        "required": ["type", "user"]
                    }
                ]
            },
            "action": {
                "type": "string"
            },
            "entity": {
                "type": "object",
                "properties": {
                    "type": {
                        "type": "string"
                    }
                },
                "required": ["type"]
            }
        },
        "required": ["id", "timestamp", "context", "action"]
    }
}
-
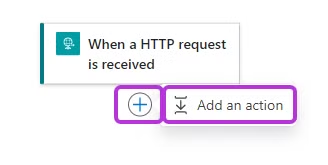
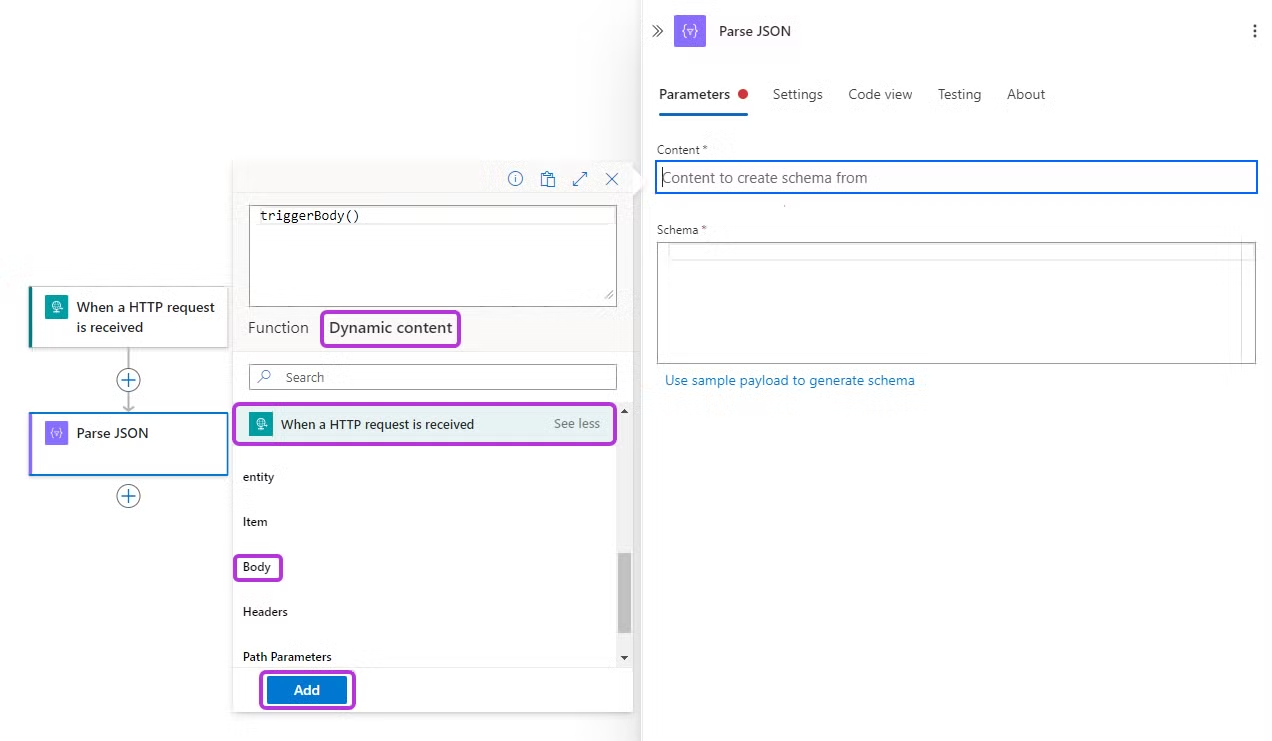
Once done, click the "+" icon below When an HTTP request is received trigger, select Add an action.
-
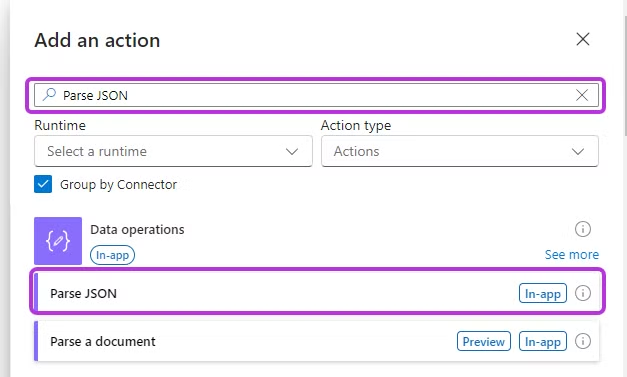
In the Add an action fly-out menu, search for Parse JSON, and select the Parse JSON item.
-
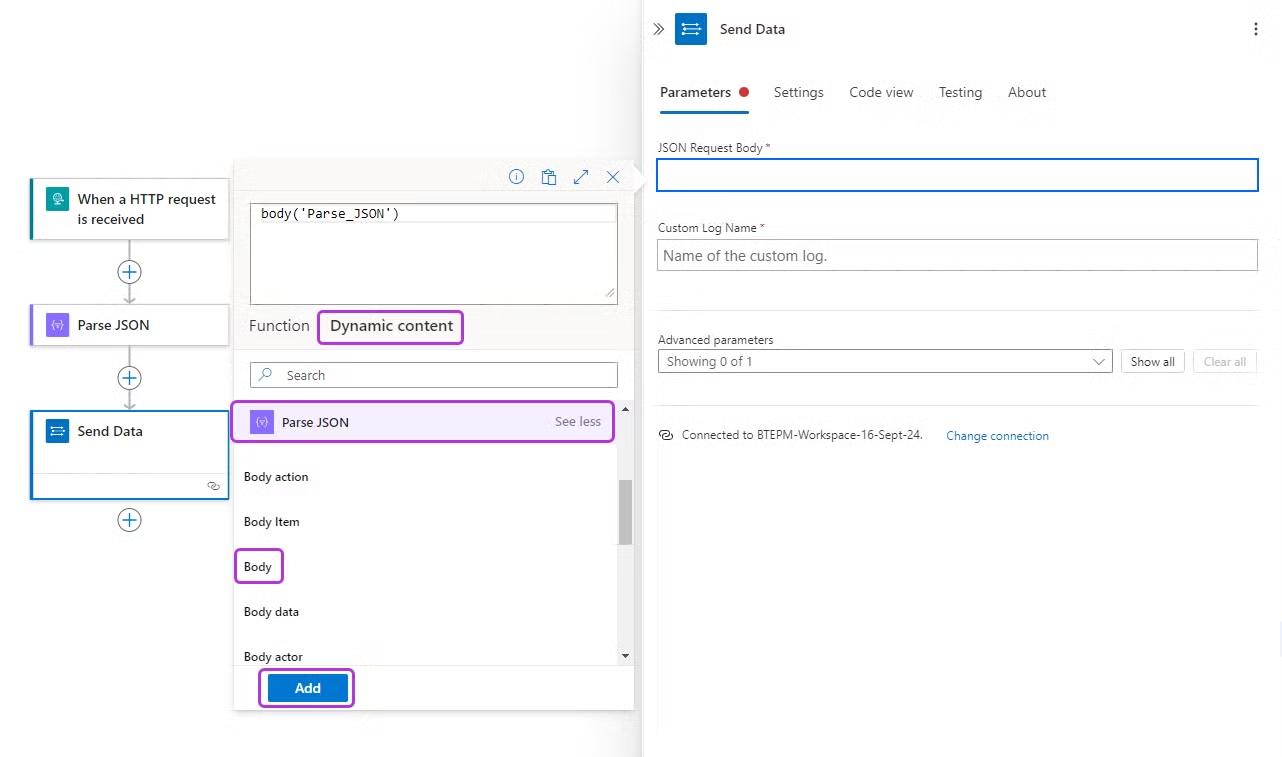
Place your cursor over the Content section and select the option to Insert expression.
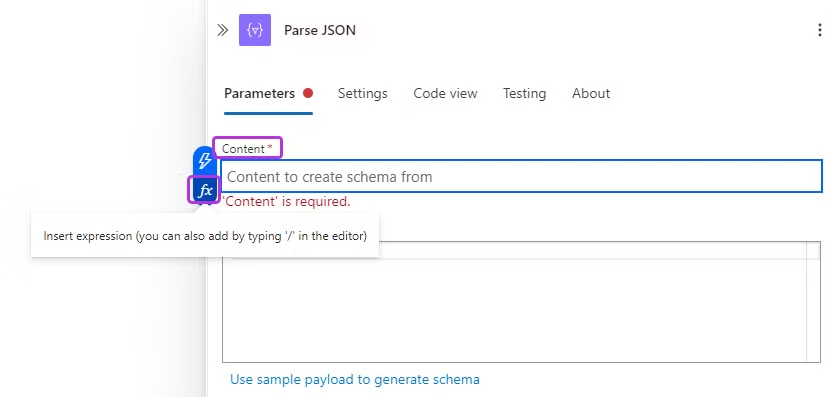
Select the Dynamic content heading from the fly-out panel. Then, select When an HTTP request is received and select the Body item (you may need to further select See more to reveal this item). Finally, click Add.
-
Paste the same schema content used for step 11 into the Parse JSON configuration, under the Schema section.
-
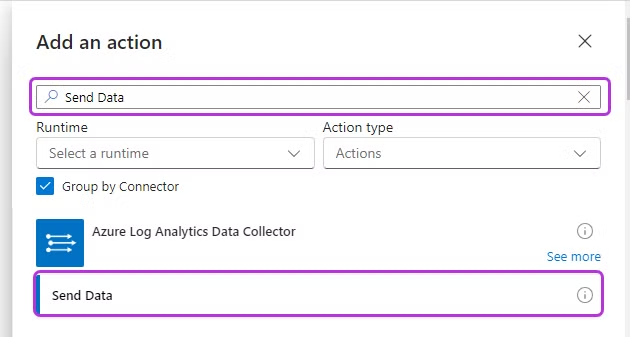
Select the "+" icon below the Parse JSON trigger, and select Add an action.
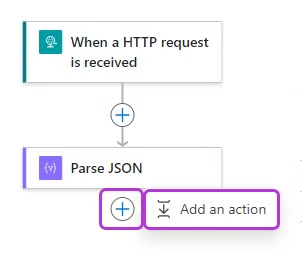
-
In the Add an action fly-out menu, search for Send Data,, and select the Send Data item for Azure Log Analytics Data Collector from the list.
-
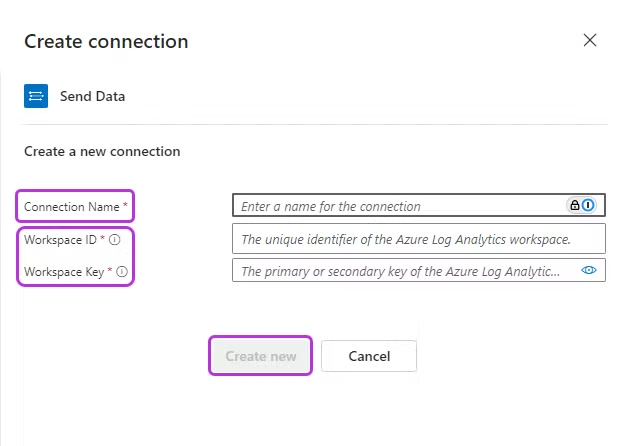
In the Send Data screen, you will need to create a new Connection, using the Workspace ID and Workspace Key data from the Log Analytics Workspace you wish to send the data to:
-
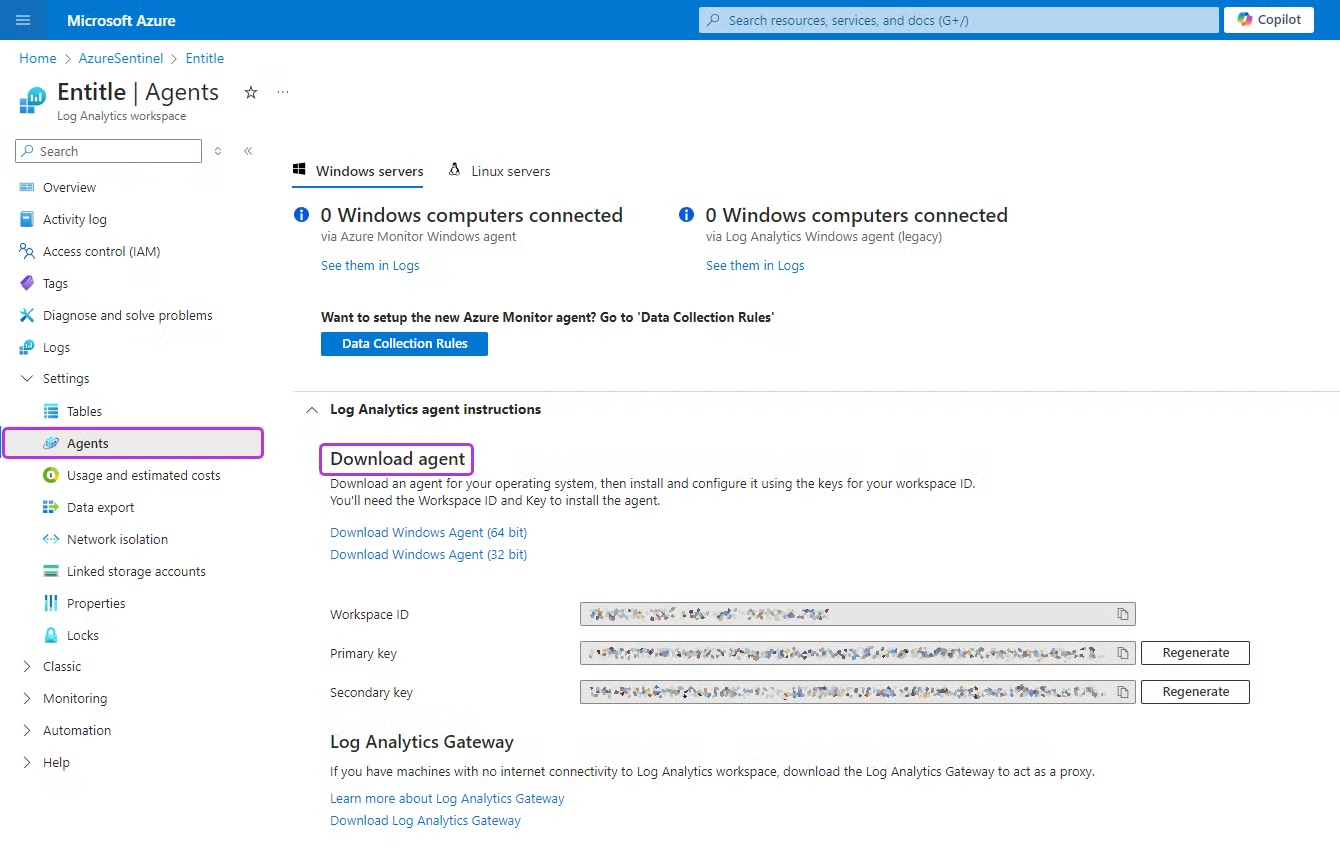
If you do not already have the ID and Key, you can retrieve them from your Log Analytics Workspace: Navigate to the Agents tab and copy the Workspace ID and Primary key values found under the Download agent section.
-
If you already have the Workspace ID and Workspace key values, enter them in the Create connection screen, along with a Name for it. Then, click Create New.
-
-
Place your cursor over the JSON Request Body section and select the option to Insert expression.
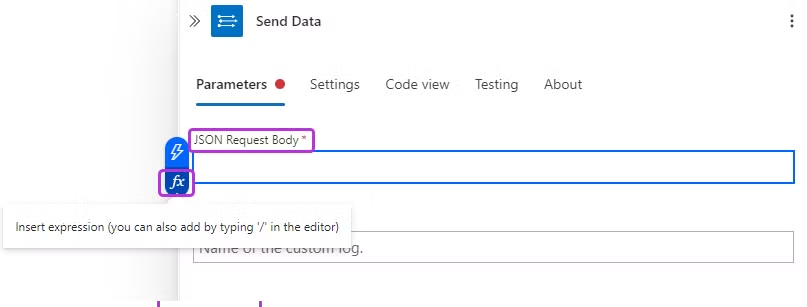
From the fly-out panel, select the Dynamic content section. Choose Parse JSON, then select the Body item (you might need to click See more to reveal this option). Finally, click Add.
-
In the Custom Log Name section, choose a Name for your Custom Log.
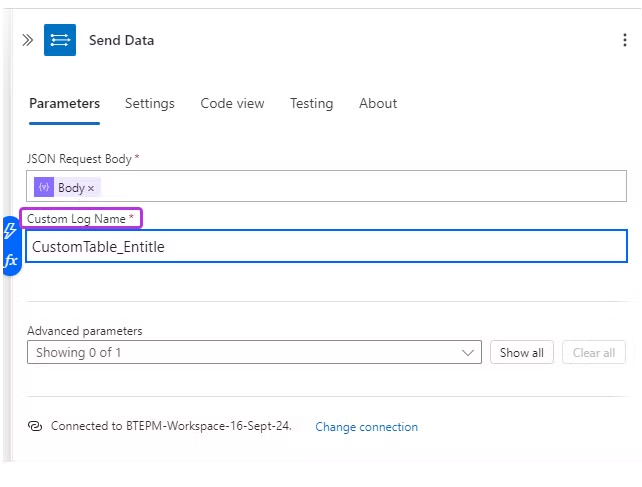
-
Click the Save button to complete the process. This may take a few moments.
-
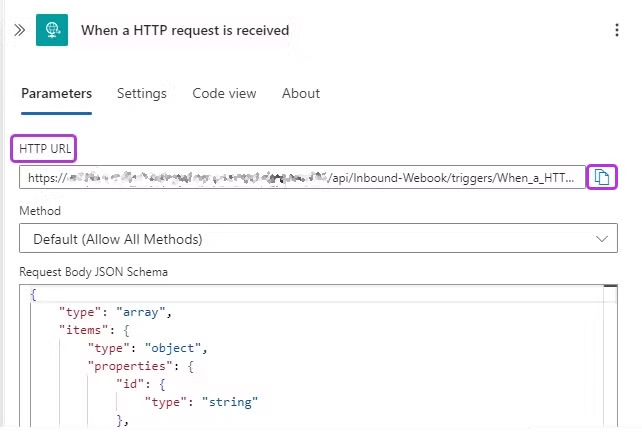
Click the When an HTTP request is received trigger.
The HTTP URL value should now be populated and can be copied as-is for the next stage - Creating Audit log webhooks in Entitle.
Stage 2: Create Audit Log webhook in Entitle
- Log in to Entitle and go to Org Settings.
- Select the the Audit logs tab. To add an Audit Log Webhook, click the Add button in the top-right corner.
- In the flyout pane, fill in the following details:
- Webhook name: Enter a name to identify your webhook.
- URL: Paste the URL you just copied from Microsoft Sentinel into this field:
This should be the final result (except the URL should be yours):
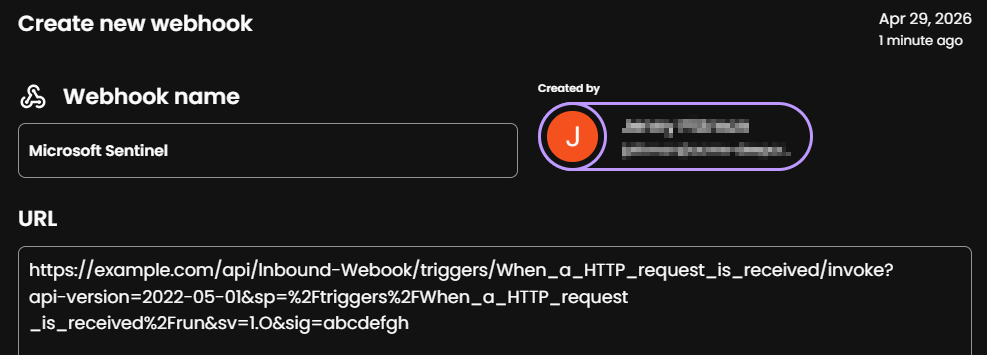
- Click Add webhook.
View Entitle Audit Logs in Microsoft Sentinel
-
It will take a few moments for the audit logs configuration to fully propagate through the infrastructure and for the audit logs to appear in Microsoft Sentinel.
-
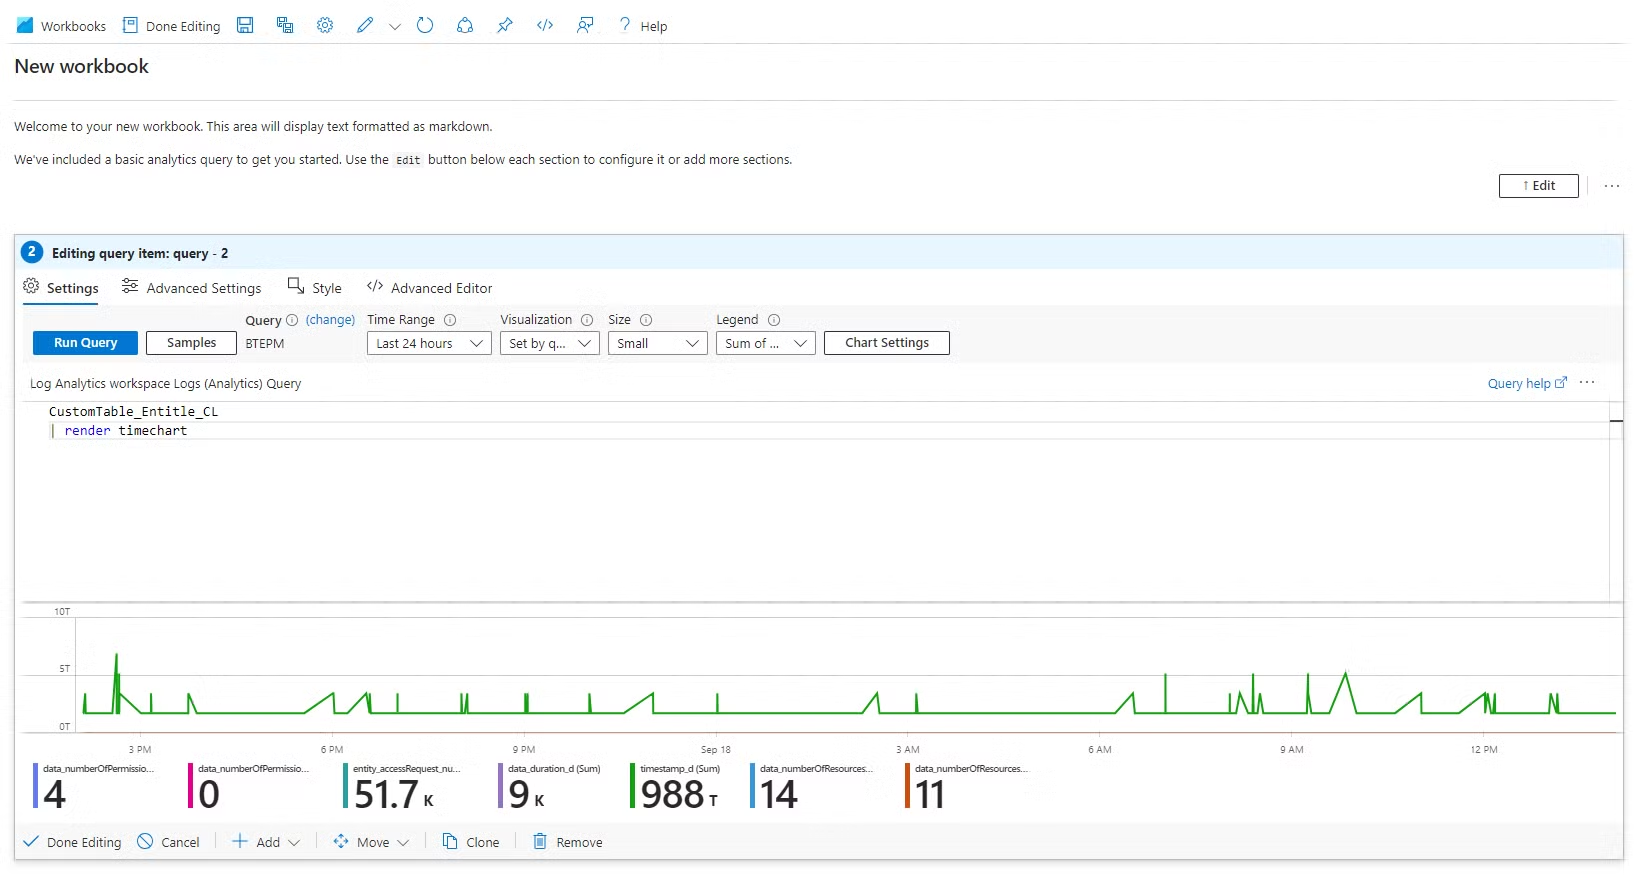
To view the raw logs, expand the Monitoring tab and select Workbooks in your Log Analytics Workspace. Then, to create a new workbook, select New.
-
In the Log Analytics Workspace Logs (Analytics) Query field, enter the custom log name supplied when configuring the Send Data action in Stage 1 step 20, and choose how to visualize the data. For example:
Updated 3 months ago