EPM for Mac performance reports | EPM-WM
26.1 report
The aim of this document is to provide data on agreed performance metrics of the Privilege Management for Mac desktop client compared to the previous release.
The content of this document should be used to provide general guidance only. There are many different factors in a live environment which could show different results, such as hardware configuration, macOS configuration and background activities, third‑party products, and the nature of the EPM policy being used.
Performance benchmarking
Test Scenario
The tests were run on a virtual machine with the following configuration:
- macOS: 26.3
- Architecture: Apple Silicon
- Memory: 8 GB RAM
Tests were completed with the GA releases:
- 25.8
- 26.1
Test Names
- Quick Start policy in High Flex, admin user
- Running the Automation Tests Suite with a monitoring tool
- Installing and building Qt5 from source
Test Method
We included three methods to test the product, all of which make use of the caching feature. For details on how to use caching, see the administrator guides in the Configure Caching on Policies section.
Three types of tests were conducted:
- The first test uses the default Quick Start policy, where we expect to match on an allowed binary with no dialog presented to the user. This ensures consistency and reduces user interaction.
The Quick Start policy is the most commonly used base policy for customers. It can be applied via MMC and WPE using Import Template. It was chosen because it represents the most common use case.
The binary launched isbashwith the-helpargument. It is executed using thehyperfinetool to produce minimum, maximum, and mean execution times for the rule‑matching engine. - The second test involves running the Automation Tests Suite and measuring component resource consumption. The suite exercises all core functionality and keeps the software under load for approximately one hour. It is intended to represent real‑world usage and includes both intensive and non‑intensive scenarios while monitoring PMfM behavior.
- The last one is about installing the Qt5 package on the system and building it from source to simulate a developer environment trying to set it up and compile code. We use the hyperfine tool to run the 'HOMEBREW_NO_AUTO=1 brew reinstall qt@5' command which executes it 10 times in a row and times the minimum and maximum in seconds for each run, also producing the mean values.
Summary
Comparing the 25.8 and 26.1 GA releases on macOS 26.3 (Apple Silicon, 8GB RAM), overall performance is broadly stable, with small improvements in consistency and resource usage in 26.1 and no material regressions identified in the measured scenarios.
For rule matching latency using the Quick Start policy, 26.1 is effectively unchanged versus 25.8 with caching enabled it is marginally faster on average (4.9 ms vs 5.0 ms) and shows a notably lower worst‑case time (12.6 ms vs 30.8 ms), while with caching disabled the mean is the same (5.6 ms) but 26.1 again improves worst‑case latency (16.1 ms vs 22.2 ms).
During the automation test suite run (caching enabled by default), 26.1 shows a clear reduction in average CPU utilization and energy impact across the main components (particularly Defendpoint and Endpoint Security), with memory usage remaining broadly comparable.
In the developer‑style Qt5 reinstall/build test, results are essentially equivalent between versions: with caching enabled both versions are ~34.6 s on average, and with caching disabled both are ~46.1 s, indicating no meaningful change in this macro workload.
As expected, the no‑EPM-M baseline remains substantially faster than either release for the synthetic and Qt5 tests, reflecting the inherent overhead of policy evaluation and monitoring.
Results
Rule Matching Latency
Hyperfine v1.19.0 was used for the first and last performance tests.
| Test / Version | Mean | Min | Max |
|---|---|---|---|
| 25.8 – Caching Enabled | 5.0 ms ± 1.4 ms | 2.7 ms | 30.8 ms |
| 26.1 – Caching Enabled | 4.9 ms ± 1.1 ms | 2.7 ms | 12.6 ms |
| 25.8 – Caching Disabled | 5.6 ms ± 1.6 ms | 3.1 ms | 22.2 ms |
| 26.1 – Caching Disabled | 5.6 ms ± 1.4 ms | 2.9 ms | 16.1 ms |
| No PMfM Installed | 1.1 ms ± 0.7 ms | 0.4 ms | 19.0 ms |
µs = microsecond, ms = millisecond
A visualization was also captured showing component resource usage when running the following command on the release candidate with caching disabled:
hyperfine --runs 1000 'bash -help'This demonstrates component load during execution and briefly afterward, due to additional processing time required to compute the 1,000 actions. All resources drop to near zero after completion.
Automation tests: Resource consumption per component
EPM-M 25.8 (Caching Enabled by Default)
Defendpoint Component
| Metric | Mean | Min | Max |
|---|---|---|---|
| CPU (%) | 6.6 | 0 | 20 |
| Memory (MB) | 13 | 8 | 20 |
| Energy Impact | 10 | 0 | 20 |
Endpoint Security Component
| Metric | Mean | Min | Max |
|---|---|---|---|
| CPU (%) | 12.5 | 0 | 25 |
| Memory (MB) | 4.5 | 2 | 8 |
| Energy Impact | 4 | 0 | 8 |
PrivilegeManagement Component
| Metric | Mean | Min | Max |
|---|---|---|---|
| CPU (%) | 1.5 | 0 | 5 |
| Memory (MB) | 22.5 | 10 | 35 |
| Energy Impact | 2 | 0 | 4 |
Interrogator Component
| Metric | Mean | Min | Max |
|---|---|---|---|
| CPU (%) | 2.9 | 0 | 18 |
| Memory (MB) | 20 | 0 | 160 |
| Energy Impact | 5 | 0 | 40 |
EPM-M 26.1 (Caching Enabled by Default)
Defendpoint Component
| Metric | Mean | Min | Max |
|---|---|---|---|
| CPU (%) | 2.5 | 0 | 8 |
| Memory (MB) | 14 | 8 | 20 |
| Energy Impact | 5 | 0 | 10 |
Endpoint Security Component
| Metric | Mean | Min | Max |
|---|---|---|---|
| CPU (%) | 2 | 0 | 4 |
| Memory (MB) | 6 | 5 | 6.5 |
| Energy Impact | 2 | 0 | 4 |
PrivilegeManagement Component
| Metric | Mean | Min | Max |
|---|---|---|---|
| CPU (%) | 1 | 0 | 4 |
| Memory (MB) | 25 | 10 | 32 |
| Energy Impact | 3 | 0 | 6 |
Interrogator Component
| Metric | Mean | Min | Max |
|---|---|---|---|
| CPU (%) | 1.7 | 0 | 13 |
| Memory (MB) | 15 | 0 | 130 |
| Energy Impact | 5 | 0 | 30 |
Installing and Building Qt5 from Source Quickstart High Flexibility policy applied
hyperfine --runs 10 'HOMEBREW_NO_AUTO=1 brew reinstall qt@5'| Test / Version | Mean (sec) | Min (sec) | Max (sec) |
|---|---|---|---|
| 25.8 – Caching Enabled | 34.693 s ± 0.409 s | 33.680 s | 35.034 s |
| 26.1 – Caching Enabled | 34.590 s ± 0.778 s | 32.447 s | 35.099 s |
| 25.8 – Caching Disabled | 46.144 s ± 0.600 s | 45.115 s | 47.212 s |
| 26.1 – Caching Disabled | 46.053 s ± 0.647 s | 44.815 s | 46.896 s |
| No EPM-M installed | 19.623 s ± 0.234 s | 19.358 s | 20.112 s |
25.8 report
The aim of this document is to provide data on agreed performance metrics of the Endpoint Privilege Management for Mac (EPM-M) desktop client compared to the previous release.
The content of this document should be used to provide general guidance only. There are many different factors in a live environment which could show different results such as hardware configuration, macOS configuration and background activities, 3rd party products, and the nature of the EPM policy being used.
Performance benchmarking
Test Scenario
The tests were ran on a virtual machine with the following configuration:
- macOS: 26.0.1
- Apple Silicon
- 8GB RAM
Tests were completed with the GA releases.
- 25.4
- 25.8
Test Names
- Quick Start policy in High flex, admin user
- Running the Automation Tests Suite with a Monitoring tool
- Installing and building Qt5 from source
Test Method
We have included three methods to test our product, all make use of the caching feature. To find out how to use our caching feature, see the information in our administrator guides in the Configure Caching on Policies section.
There were three types of tests conducted:
- The first one uses the default quick start policy where we expect to match on an allowed binary with no dialog presented to the user, ensuring consistency and reducing user interaction.
The quick start policy is the policy that's most commonly used as a base for all of our customers. It can be applied by the MMC and Policy Editor with Import Template. It was chosen as it's our most common use case. The binary we're launching is bash with the -help argument, and we run it through the hyperfine tool during the test process to produce the minimum, maximum and mean time of our rule matching engine. - The next one involves running our Automation Tests Suite and measuring the components resource consumption. We conduct tests on all of our core functionality with our automation suite and keeps our software under load for approximately an hour. We’ve used the Automation Tests Suite to portray as close as possible a real life environment usage and to monitor EPM-M through all types of intensive and non intensive scenarios.
- The last one is about installing the Qt5 package on the system and building it from source to simulate a developer environment trying to set it up and compile code. We use the hyperfine tool to run the 'HOMEBREW_NO_AUTO=1 brew reinstall qt@5' command which executes it 10 times in a row and times the minimum and maximum in seconds for each run, also producing the mean values.
Summary
Comparing the 25.8 performance results against 25.4, we can observe a noticeable performance increase for the 25.8 candidate for the first synthetic test of around 20% and a performance decrease for the 25.8 candidate for the third synthetic test of around 5%. There is a performance increase overall and is due to our work to increase our product’s quality and to reduce our bug count. The third synthetic test had a negligible performance decrease and this might be due to the work we’ve done for the Identity feature. The synthetic tests were done at a micro level focusing on a single binary and at a macro level focusing on multiple binaries being run while installing and building from source.
Also, analyzing the automation resource consumption data for the 25.8 release candidate, we can see high negligible increases in resource consumption for Defendpoint, Endpoint Security and Interrogator when compared to the previous release of EPM-M and this performance degradation can be attributed to the introduction of the Identity work. The exception was the Privilege Management component which has improved considerably in resource consumption with more than 100% for the CPU and more than 20% for the memory and this can be explained by the fact that we’ve updated our Qt framework to the latest, which had major UI improvements.
Overall, we can observe a slight decrease in performance on the critical components on both synthetic and the automation runs and this is due to the Identity feature which is tied to the policy loading and the rules engine logic.
Results
Rule matching latency
Note: Hyperfine v1.19.0 was used to get the results for the first and last set of performance tests.
| Test/version | Mean | Min | Max |
|---|---|---|---|
| 25.4 Process Matching Rule Latency → caching enabled | 1.6 ms ± 0.9 ms | 0.9 ms | 17.7 ms |
| 25.8 Process Matching Rule Latency → caching enabled | 1.4 ms ± 0.7 ms | 0.8 ms | 16.8 ms |
| 25.4 Process Matching Rule Latency → caching disabled | 2.0 ms ± 0.4 ms | 1.2 ms | 4.3 ms |
| 25.8 Process Matching Rule Latency → caching disabled | 1.5 ms ± 0.8 ms | 0.7 ms | 17.1 ms |
| No EPM-M installed | 1.1 ms ± 0.5 ms | 0.5 ms | 8.5 ms |
µs is microsecond. ms is millisecond.
Automation Tests resource consumption per component
EPM-M 25.4 caching enabled by default
| Defendpoint Component | Mean | Min | Max |
|---|---|---|---|
| CPU % | 1.326304 | 0 | 13.7 |
| Memory (mb) | 14.13608512 | 6.881 | 15 |
| Energy Impact | 1.3264 | 0 | 13.7 |
| Endpoint Security Component | Mean | Min | Max |
|---|---|---|---|
| CPU % | 1.91942675159236 | 1 | 6.5 |
| Memory (mb) | 6.02984585987259 | 4.737 | 6.225 |
| Energy Impact | 1.91942675159236 | 1 | 6.5 |
| PrivilegeManagement Component | Mean | Min | Max |
|---|---|---|---|
| CPU % | 6.18280295724845 | 0 | 66.8 |
| Memory (mb) | 22.4474445515912 | 11 | 48 |
| Energy Impact | 6.1828993892639 | 0 | 66.8 |
| Interrogator Component | Mean | Min | Max |
|---|---|---|---|
| CPU % | 0.970239596469107 | 0 | 13 |
| Memory (mb) | 16.8742906683481 | 5.361 | 164 |
| Energy Impact | 0.970239596469107 | 0.0 | 13 |
EPM-M 25.8 caching enabled by default
| Defendpoint Component | Mean | Min | Max |
|---|---|---|---|
| CPU % | 1.67261637239166 | 0 | 21.2 |
| Memory (mb) | 14.6349528089888 | 7.329 | 20 |
| Energy Impact | 1.67280898876404 | 0 | 21.2 |
| Endpoint Security Component | Mean | Min | Max |
|---|---|---|---|
| CPU % | 2.27084669660039 | 0.4 | 32.2 |
| Memory (mb) | 6.14718088518281 | 3.057 | 6.417 |
| Energy Impact | 2.27084669660039 | 0.4 | 32.2 |
| PrivilegeManagement Component | Mean | Min | Max |
|---|---|---|---|
| CPU % | 1.17510480490164 | 0 | 55.4 |
| Memory (mb) | 17.7984521122219 | 14 | 40 |
| Energy Impact | 1.17520154788778 | 0 | 55.4 |
| Interrogator Component | Mean | Min | Max |
|---|---|---|---|
| CPU % | 1.15989815404201 | 0 | 13.5 |
| Memory (mb) | 17.5108459579885 | 4.545 | 156 |
| Energy Impact | 1.15989815404201 | 0 | 13.5 |
Installing and building Qt5 from source with a Quickstart High Flexibility policy applied
Hyperfine --runs 10 'HOMEBREW_NO_AUTO=1 brew reinstall qt@5'| Test/version | Mean(sec) | Min(sec) | Max(sec) |
|---|---|---|---|
| 25.4 with Caching Disabled | 39.263 s ± 0.768 s | 38.334 s | 41.054 s |
| 25.8 with Caching Enabled | 41.249 s ± 0.923 s | 40.016 s | 42.624 s |
| 25.4 with Caching Disabled | 51.846 s ± 0.665 s | 51.031 s | 44.233 s |
| 25.8 with Caching Enabled | 55.544 s ± 1.727 s | 53.459 s | 42.199 s |
| No EPM-M installed | 29.437 s ± 1.215 s | 27.981 s | 31.456 s |
25.4 report
The aim of this document is to provide data on agreed performance metrics of the Privilege Management for Mac desktop client compared to the previous release.
The content of this document should be used to provide general guidance only. The are many different factors in a live environment which could show different results such as hardware configuration, macOS configuration and background activities, 3rd party products, and the nature of the EPM policy being used.
Performance benchmarking
Test Scenario
The tests were ran on a virtual machine with the following configuration:
- macOS: 13.4.1
- Apple Silicon
- 8GB RAM
Tests were completed with the GA releases.
- 24.2
- 25.4
Test Names
Quick Start policy in High flex, admin user
Running the Automation Tests Suite with a Monitoring tool
Installing and building Qt5 from source
Test Method
We have included three methods to test our product, all make use of the caching feature. To find out how to use our caching feature, see the information in our administrator guides in the Configure Caching on Policies section.
There were three types of tests conducted:
- The first one uses the default quick start policy where we expect to match on an allowed binary with no dialog presented to the user, ensuring consistency and reducing user interaction.
The QuickStart policy is the policy that's most commonly used as a base for all of our customers. It can be applied by the MMC and WPE with Import Template. It was chosen as it's our most common use case. The binary we're launching is bash with the -help argument, and we run it through the hyperfine tool during the test process to produce the minimum, maximum and mean time of our rule matching engine. - The next one involves running our Automation Tests Suite and measuring the components resource consumption. We conduct tests on all of our core functionality with our automation suite and keeps our software under load for approximately an hour. We’ve used the Automation Tests Suite to portray as close as possible a real life environment usage and to monitor EPM-M through all types of intensive and non intensive scenarios.
- The last one is about installing the Qt5 package on the system and building it from source to simulate a developer environment trying to set it up and compile code. We use the hyperfine tool to run the 'HOMEBREW_NO_AUTO=1 brew reinstall qt@5' command which executes it 10 times in a row and times the minimum and maximum in seconds for each run, also producing the mean values.
Summary
Comparing the 25.4 performance results against 25.2, we can observe a noticeable performance increase for the 25.4 candidate with both caching being enabled or disabled for the first and third synthetic tests of around 10%. This is because for this release we’ve focused more on decreasing our bug count and in doing so we’ve also improved performance. The synthetic tests were done at a micro level focusing on a single binary and at a macro level focusing on multiple binaries being run while installing and building from source.
Also, analyzing the automation resource consumption data for the 25.4 release candidate, we can see negligible increases and decreases in resource consumption for the Defendpoint, EndpointSecurity and Interrogator components when compared to the previous release of PMfM. This time around the PrivilegeManagement component had a decrease in memory consumption of about 4-5 MB from 16.9 Mb to 12.02 Mb.
Overall, we can observe a noticeable improvement in performance for both the synthetic and the automation resource consumption tests.
Results
Rule matching latency
Note: Hyperfine v1.19.0 used both 25.2 and 25.4 for the results of tests 1 and 3.
| Test/version | Mean | Min | Max |
|---|---|---|---|
| 25.2 Process Matching Rule Latency With Caching | 1.3 ms ± 0.5 ms | 0.9 ms | 3.8 ms |
| 25.4 Process Matching Rule Latency With Caching | 1.0 ms ± 0.5 ms | 0.5 ms | 4.1 ms |
| 25.2 Process Matching Rule Latency No Caching | 1.7 ms ± 0.6 ms | 1.2 ms | 4.4 ms |
| 25.4 Process Matching Rule Latency No Caching | 1.2 ms ± 0.6 ms | 0.5 ms | 6.3 ms |
| No EPM-M installed | 811.8 µs ± 378.8 µs | 341.8 µs | 3150.2 µs |
µs is microsecond. ms is millisecond.
Automation Tests resource consumption per component
EPM-M 25.2 caching enabled by default
| Defendpoint Component | Mean | Min | Max |
|---|---|---|---|
| CPU % | 1.32549088979303 | 0.0 | 7.2 |
| Memory (mb) | 11.9631655758004 | 6.881 | 15 |
| Energy Impact | 1.32552626923758 | 0.0 | 7.2 |
| Endpoint Security Component | Mean | Min | Max |
|---|---|---|---|
| CPU % | 2.15252489331436 | 1 | 9.5 |
| Memory (mb) | 6.05704267425319 | 4.465 | 6.273 |
| Energy Impact | 2.15252489331436 | 1 | 9.5 |
| PrivilegeManagement Component | Mean | Min | Max |
|---|---|---|---|
| CPU % | 0.0793121881682109 | 0.0 | 10.3 |
| Memory (mb) | 16.9227305773342 | 9.778 | 37 |
| Energy Impact | 0.0793300071275837 | 0.0 | 10.3 |
| Interrogator Component | Mean | Min | Max |
|---|---|---|---|
| CPU % | 0.404340155257587 | 0.0 | 6.9 |
| Memory (mb) | 107.7484350741 | 7.489 | 147 |
| Energy Impact | 0.404357798165137 | 0.0 | 6.9 |
EPM-M 25.4 caching enabled by default
| Defendpoint Component | Mean | Min | Max |
|---|---|---|---|
| CPU % | 2.08972089857045 | 0.0 | 11.1 |
| Memory (mb) | 11.7368029271613 | 7.265 | 15 |
| Energy Impact | 2.08975493533015 | 0.0 | 11.1 |
| Endpoint Security Component | Mean | Min | Max |
|---|---|---|---|
| CPU % | 2.53236832926405 | 1.2 | 28.22 |
| Memory (mb) | 5.94409312870597 | 4.401 | 6.049 |
| Energy Impact | 2.53236832926405 | 1.2 | 28.2 |
| PrivilegeManagement Component | Mean | Min | Max |
|---|---|---|---|
| CPU % | 0.153010790114863 | 0.0 | 26.8 |
| Memory (mb) | 12.0163898364079 | 9.842 | 32 |
| Energy Impact | 0.153080403759137 | 0.0 | 26.8 |
| Interrogator Component | Mean | Min | Max |
|---|---|---|---|
| CPU % | 0.897457627118645 | 0.0 | 12.9 |
| Memory (mb) | 111.679867457627 | 7.713 | 143 |
| Energy Impact | 0.897457627118645 | 0.0 | 12.9 |
Installing and building Qt5 from source with a Quickstart High Flexibility policy applied
Hyperfine --runs 10 'HOMEBREW_NO_AUTO=1 brew reinstall qt@5'| Test/version | Mean(sec) | Min(sec) | Max(sec) |
|---|---|---|---|
| 25.2 with Caching Disabled | 39.503 s ± 1.484 s | 36.066 s | 40.859 s |
| 25.4 with Caching Enabled | 36.829 s ± 0.635 s | 35.992 s | 37.706 s |
| 25.2 with Caching Disabled | 41.589 s ± 1.082 s | 40.570 s | 44.233 s |
| 25.4 with Caching Enabled | 38.410 s ± 1.897 s | 36.201 s | 42.199 s |
| No EPM-M installed | 20.045 s ± 0.458 s | 19.348 s | 20.893 s |
25.2 report
The aim of this document is to provide data on agreed performance metrics of the Privilege Management for Mac desktop client compared to the previous release.
The content of this document should be used to provide general guidance only. The are many different factors in a live environment which could show different results such as hardware configuration, macOS configuration and background activities, 3rd party products, and the nature of the EPM policy being used.
Performance benchmarking
Test Scenario
The tests were ran on a virtual machine with the following configuration:
- macOS: 13.4.1
- Apple Silicon
- 8GB RAM
Tests were completed with the GA releases.
- 24.7
- 25.2
Test Names
Quick Start policy in High flex, admin user
Running the Automation Tests Suite with a Monitoring tool
Installing and building Qt5 from source
Test Method
We have included three methods to test our product, all make use of the caching feature. To find out how to use our caching feature, see the information in our administrator guides in the Configure Caching on Policies section.
There were three types of tests conducted:
- The first one uses the default quick start policy where we expect to match on an allowed binary with no dialog presented to the user, ensuring consistency and reducing user interaction.
The QuickStart policy is the policy that's most commonly used as a base for all of our customers. It can be applied by the MMC and WPE with Import Template. It was chosen as it's our most common use case. The binary we're launching is bash with the -help argument, and we run it through the hyperfine tool during the test process to produce the minimum, maximum and mean time of our rule matching engine. - The next one involves running our Automation Tests Suite and measuring the components resource consumption. We conduct tests on all of our core functionality with our automation suite and keeps our software under load for approximately an hour. We’ve used the Automation Tests Suite to portray as close as possible a real life environment usage and to monitor EPM-M through all types of intensive and non intensive scenarios.
- The last one is about installing the Qt5 package on the system and building it from source to simulate a developer environment trying to set it up and compile code. We use the hyperfine tool to run the 'HOMEBREW_NO_AUTO=1 brew reinstall qt@5' command which executes it 10 times in a row and times the minimum and maximum in seconds for each run, also producing the mean values.
Summary
Comparing the 25.2 performance results against 24.7, we can observe a negligible decrease in performance for the 25.2 candidate with both caching being enabled or disabled for the 1 and 3 synthetic tests, starting from 0.3% and going up to 2.5%. This is because we’ve focused on tightening our security of the product and in doing so we’ve added some extra checks that slightly degrade the performance. The tests were done at a micro level focusing on a single binary and at a macro level focusing on multiple binaries being run while installing and building from source.
Also, analyzing the automation resource consumption data for the 25.2 release candidate, we can see negligible increases and decreases in resource consumption for the Defendpoint, EndpointSecurity and Interrogator components when compared to the previous release of EPM-M, and the only component that has a noticeable resource consumption rise is PrivilegeManagement with an increase from 10 Mb to 16 Mb in memory consumption, and considering that the memory doesn’t leak and this component handles UI elements and requires varying amounts of memory to render them, we would conclude that this is within normal behaviour.
Overall, we can observe a negligible increase/decrease in performance and a slight performance degradation on memory consumption for the PrivilegeManagement component.
Results
Rule matching latency
Note: Hyperfine v1.19.0 used both 24.5 and 24.7 for the results of tests 1 and 3.
| Test/version | Mean | Min | Max |
|---|---|---|---|
| 24.7 Process Matching Rule Latency With Caching | 3.8 ms ± 1.5 ms [User: 0.3 ms, System: 0.6 ms] | 1.7 ms | 24.6 ms |
| 25.2 Process Matching Rule Latency With Caching | 3.9 ms ± 1.3 ms [User: 0.3 ms, System: 0.6 ms] | 2.1 ms | 8.7 ms |
| 24.7 Process Matching Rule Latency No Caching | 5.0 ms ± 2.1 ms [User: 0.3 ms, System: 0.9 ms] | 2.5 ms | 29.9 ms |
| 25.2 Process Matching Rule Latency No Caching | 5.1 ms ± 1.8 ms [User: 0.3 ms, System: 0.9 ms] | 2.5 ms | 53.9 ms |
| No EPM-M installed | 606.0 µs ± 376.4 µs [User: 182.5 µs, System: 341.2 µs] | 71.4 µs | 4097.2 µs |
µs is microsecond. ms is millisecond.
Automation Tests resource consumption per component
EPM-M 25.2 caching enabled by default
| Defendpoint Component | Mean | Min | Max |
|---|---|---|---|
| CPU % | 1.32549088979303 | 0.0 | 7.2 |
| Memory (mb) | 11.9631655758004 | 6.881 | 15 |
| Energy Impact | 1.32552626923758 | 0.0 | 7.2 |
| Endpoint Security Component | Mean | Min | Max |
|---|---|---|---|
| CPU % | 2.15252489331436 | 1 | 9.5 |
| Memory (mb) | 6.05704267425319 | 4.465 | 6.273 |
| Energy Impact | 2.15252489331436 | 1 | 9.5 |
| PrivilegeManagement Component | Mean | Min | Max |
|---|---|---|---|
| CPU % | 0.0793121881682109 | 0.0 | 10.3 |
| Memory (mb) | 16.9227305773342 | 9.778 | 37 |
| Energy Impact | 0.0793300071275837 | 0.0 | 10.3 |
| Interrogator Component | Mean | Min | Max |
|---|---|---|---|
| CPU % | 0.404340155257587 | 0.0 | 6.9 |
| Memory (mb) | 107.7484350741 | 7.489 | 147 |
| Energy Impact | 0.404357798165137 | 0.0 | 6.9 |
EPM-M 24.7 caching enabled by default
| Defendpoint Component | Mean | Min | Max |
|---|---|---|---|
| CPU % | 1.56248169838946 | 0.0 | 8.6 |
| Memory (mb) | 11.1754454612006 | 6.737 | 17 |
| Energy Impact | 1.56255490483162 | 0.0 | 8.6 |
| Endpoint Security Component | Mean | Min | Max |
|---|---|---|---|
| CPU % | 2.26577617328521 | 0.8 | 7.6 |
| Memory (mb) | 6.02804981949458 | 3.073 | 6.609 |
| Energy Impact | 2.26577617328521 | 0.8 | 7.6 |
| PrivilegeManagement Component | Mean | Min | Max |
|---|---|---|---|
| CPU % | 0.0464388489208633 | 0.0 | 11.1 |
| Memory (mb) | 10.3940658273381 | 7.537 | 30 |
| Energy Impact | 0.0464388489208633 | 0.0 | 11.1 |
| Interrogator Component | Mean | Min | Max |
|---|---|---|---|
| CPU % | 0.820827285921625 | 0.0 | 10.2 |
| Memory (mb) | 104.806075834543 | 4.417 | 140 |
| Energy Impact | 0.820863570391873 | 0.0 | 10.2 |
Installing and building Qt5 from source with a Quickstart High Flexibility policy applied
Hyperfine --runs 10 'HOMEBREW_NO_AUTO=1 brew reinstall qt@5'| Test/version | Mean(sec) | Min(sec) | Max(sec) |
|---|---|---|---|
| 24.7 with Caching Disabled | 31.875 s ± 2.486 s [User: 6.091 s, System: 11.746 s] | 30.271 s | 38.766 s |
| 25.2 with Caching Enabled | 31.889 s ± 0.652 s [User: 5.980 s, System: 11.690 s] | 30.923 s | 32.679 s |
| 24.7 with Caching Disabled | 38.977 s ± 0.560 s [User: 6.056 s, System: 12.224 s] | 38.007 s | 39.884 s |
| 25.2 with Caching Enabled | 38.847 s ± 1.192 s [User: 5.913 s, System: 12.039 s] | 37.183 s | 41.160 s |
| No EPM-M installed | 21.889 s ± 0.350 s [User: 5.758 s, System: 9.653 s] | 21.417 s | 22.479 |
24.7 report
The aim of this document is to provide data on agreed performance metrics of the Privilege Management for Mac desktop client compared to the previous release.
The content of this document should be used to provide general guidance only. The are many different factors in a live environment which could show different results such as hardware configuration, macOS configuration and background activities, 3rd party products, and the nature of the EPM policy being used.
Performance benchmarking
Test Scenario
The tests were ran on a virtual machine with the following configuration:
- macOS: 13.4.1
- Apple Silicon
- 8GB RAM
Tests were completed with the GA releases.
- 24.5
- 24.7
Test Names
- Quick Start policy in High flex, admin user
- Running the Automation Tests Suite with a Monitoring tool
- Installing and building Qt5 from source
Test Method
We have included three methods to test our product, all make use of the caching feature. To find out how to use our caching feature, see the information in our administrator guides in the Configure Caching on Policies section.
There were three types of tests conducted:
- The first one uses the default quick start policy where we expect to match on an allowed binary with no dialog presented to the user, ensuring consistency and reducing user interaction.
The quick start policy is the policy that's most commonly used as a base for all of our customers. It can be applied by the MMC and WPE with Import Template. It was chosen as it's our most common use case. The binary we're launching is bash with the -help argument, and we run it through the hyperfine tool during the test process to produce the minimum, maximum and mean time of our rule matching engine.
- The next one involves running our Automation Tests Suite and measuring the components resource consumption. We conduct tests on all of our core functionality with our automation suite and keeps our software under load for approximately an hour. We’ve used the Automation Tests Suite to portray as close as possible a real life environment usage and to monitor PMfM through all types of intensive and non intensive scenarios.
- The last one is about installing the Qt5 package on the system and building it from source to simulate a developer environment trying to set it up and compile code. We use the hyperfine tool to run the 'HOMEBREW_NO_AUTO=1 brew reinstall qt@5' command which executes it 10 times in a row and times the minimum and maximum in seconds for each run, also producing the mean values.
Summary
Comparing 24.7 results against 24.5, we can observe a small increase in performance for the 24.7 candidate with or without caching enabled for the 1 and 3 synthetic tests, starting from 2% and going up to 12%. This is because we’ve either removed some of our logging messages or we’ve not included them into our release builds. The tests were done at a micro level focusing on a single binary and at a macro level focusing on multiple binaries being run while installing and building from source.
On the other hand, looking at our automation performance data for the 24.7 release candidate, we can see a small increase in resource consumption for some components when compared to the previous release of PMfM, and this can be explained by the new addition of the JIT Admin and Application features.
Overall, we can observe a small variable increase in performance on focused time-boxed tests and a slight performance degradation in resource consumption when running the full automation suite.
Results
Rule matching latency
Note: Hyperfine v1.19.0 used both 24.5 and 24.7 for the results of tests 1 and 3.
| Test/version | Mean | Min | Max |
|---|---|---|---|
| 24.5 Process Matching Rule Latency With Caching | 4.5 ms ± 3.1 ms [User: 0.3 ms, System: 0.7 ms] | 1.9 ms | 48.3 ms |
| 24.7 Process Matching Rule Latency With Caching | 4.3 ms ± 1.6 ms [User: 0.3 ms, System: 0.8 ms] | 2.3 ms | 36.1 ms |
| 24.5 Process Matching Rule Latency No Caching | 5.4 ms ± 3.9 ms [User: 0.4 ms, System: 1.1 ms] | 2.6 ms | 56.7 ms |
| 24.7 Process Matching Rule Latency No Caching | 5.3 ms ± 3.3 ms [User: 0.4 ms, System: 1.1 ms] | 2.5 ms | 53.9 ms |
| No EPM-M installed | 1.4 ms ± 1.6 ms [User: 0.3 ms, System: 0.6 ms] | 0.0 ms | 34.0 ms |
µs is microsecond. ms is millisecond.
Automation Tests resource consumption per component
EPM-M 24.7 caching disabled
| Defendpoint Component | Mean | Min | Max |
|---|---|---|---|
| CPU % | 0.68 | 0.0 | 5.0 |
| Memory (mb) | 10.09 | 6.64 | 14.0 |
| Energy Impact | 0.69 | 0.0 | 5.0 |
| Endpoint Security Component | Mean | Min | Max |
|---|---|---|---|
| CPU % | 0.62 | 0.0 | 5.1 |
| Memory (mb) | 5.7 | 4.47 | 5.78 |
| Energy Impact | 0.67 | 0.0 | 5.1 |
| PrivilegeManagement Component | Mean | Min | Max |
|---|---|---|---|
| CPU % | 0.06 | 0.0 | 2.4 |
| Memory (mb) | 9.99 | 7.55 | 10.0 |
| Energy Impact | 0.09 | 0.0 | 5.2 |
| Interrogator Component | Mean | Min | Max |
|---|---|---|---|
| CPU % | 1.05 | 0.0 | 8.0 |
| Memory (mb) | 107.44 | 56.0 | 158.0 |
| Energy Impact | 1.05 | 0.0 | 8.0 |
EPM-M 24.5 caching disabled
| Defendpoint Component | Mean | Min | Max |
|---|---|---|---|
| CPU % | 0.6 | 0.0 | 5.0 |
| Memory (mb) | 9.89 | 6.4 | 17 |
| Energy Impact | 0.6 | 0.0 | 5.0 |
| Endpoint Security Component | Mean | Min | Max |
|---|---|---|---|
| CPU % | 0.53 | 0.0 | 5.3 |
| Memory (mb) | 5.49 | 3.12 | 5.6 |
| Energy Impact | 0.58 | 0.0 | 5.3 |
| PrivilegeManagement Component | Mean | Min | Max |
|---|---|---|---|
| CPU % | 0.07 | 0.0 | 8.7 |
| Memory (mb) | 10.49 | 9.76 | 33 |
| Energy Impact | 0.10 | 0.0 | 8.9 |
| Interrogator Component | Mean | Min | Max |
|---|---|---|---|
| CPU % | 0.93 | 0.0 | 7.8 |
| Memory (mb) | 103.25 | 4.19 | 135.0 |
| Energy Impact | 0.93 | 0.0 | 7.8 |
Installing and building Qt5 from source with a QuickStart High Flexibility policy applied
Hyperfine --runs 10 'HOMEBREW_NO_AUTO=1 brew reinstall qt@5'| Test/version | Mean(sec) | Min(sec) | Max(sec) |
|---|---|---|---|
| 24.5 with Caching Disabled | 37.972 s ± 1.254 s [User: 6.533 s, System: 13.859 s] | 36.182 s | 40.011 s |
| 24.7 with Caching Enabled | 35.031 s ± 2.143 s [User: 6.201 s, System: 13.159 s] | 32.126 s | 38.467 s |
| 24.5 with Caching Disabled | 59.099 s ± 2.677 s [User: 6.997 s, System: 16.516 s] | 54.506 s | 62.046 s |
| 24.7 with Caching Enabled | 52.814 s ± 3.105 s [User: 6.549 s, System: 15.011 s] | 48.409 s | 58.204 s |
| No EPM-M installed | 29.046 s ± 3.159 s [User: 6.294 s, System: 11.815 s] | 23.995 s | 32.816 s |
24.5 report
The aim of this document is to provide data on agreed performance metrics of the EPM-M desktop client compared to the previous release.
The content of this document should be used to provide general guidance only. There are many different factors in a live environment which could show different results such as hardware configuration, macOS configuration and background activities, 3rd party products, and the nature of the EPM policy being used.
Performance benchmarking
Test scenario
The tests were ran on a physical machine with the following configuration:
- macOS: 14.5
- Apple Silicon
- 16GB RAM
Tests were completed with the GA releases.
- 24.3
- 24.5
Test names
- Quick Start policy in High flex, admin user
- Running the Automation Tests Suite with a Monitoring tool
- Installing and building Qt5 from source
Test method
We have included three methods to test our product, all make use of the caching feature.
There were three types of tests conducted:
- The first one uses the default quick start policy where we expect to match on an allowed binary with no dialog presented to the user, ensuring consistency and reducing user interaction.
The Quick Start policy is the policy that's most commonly used as a base for all of our customers. It can be applied by the MMC and WPE with Import Template. It was chosen as it's our most common use case. The binary we're launching is bash with the -help argument, and we run it through the hyperfine tool during the test process to produce the minimum, maximum and mean time of our rule matching engine.
- The next one involves running our Automation Tests Suite and measuring the components resource consumption. We conduct tests on all of our core functionality with our automation suite and keep our software under load for approximately an hour. We’ve used the Automation Tests Suite to portray as close as possible a real life environment usage and to monitor EPM-M through all types of intensive and non intensive scenarios.
- The last one is about installing the Qt5 package on the system and building it from source to simulate a developer environment trying to set it up and compile code. We use the hyperfine tool to run the 'HOMEBREW_NO_AUTO=1 brew reinstall qt@5' command which executes it 10 times in a row and times the minimum and maximum in seconds for each run, also producing the mean values.
Summary
Comparing 24.3 results against 24.5, we can observe no major differences between these two builds when caching is disabled but there is a 10-15% improvement when caching is enabled. This is due to a new performance improvement feature that introduces caching for file reads on the system.
The tests were done at a micro level focusing on a single binary and at a macro level focusing on multiple binaries being run while installing and building from source.
You may see a negative impact on performance when compared to the previous release of EPM-M but this can be attributed to a increase of automation especially around URM and the addition of URM which is a Just In Time procedure so modifications are made instantly.
Overall there is no performance degradation and the resource consumption differences between the automation runs are negligible, with a substantial performance improvement when caching is enabled.
Results
Rule matching latency
Hyperfine v1.18 used both 24.3 and 24.5 for the results of tests 1 and 3.
| Test/version | Mean | Min | Max |
|---|---|---|---|
| 24.5 Process Matching Rule Latency With Caching | 7.3 ms ± 5.9 ms [User: 0.7 ms, System: 1.5 ms] | 0.2 ms | 35.0 ms |
| 24.3 Process Matching Rule Latency With Caching | 6.9 ms ± 2.1 ms [User: 0.7 ms, System: 1.6 ms] | 1.4 ms | 11.0 ms |
| 24.3 Process Matching Rule Latency No Caching | 9.0 ms ± 3.9 ms [User: 0.6 ms, System: 1.6 ms] | 1.3 ms | 20.5 ms |
| 24.5 Process Matching Rule Latency No Caching | 8.1 ms ± 11.3 ms [User: 0.6 ms, System: 1.4 ms] | 2.1 ms | 107.7 ms |
| No EPM-M installed | 2.1 ms ± 1.6 ms [User: 0.5 ms, System: 1.0 ms] | 0.0 ms | 6.0 ms |
µs is microsecond. ms is millisecond.
Automation tests resource consumption per component
EPM-M 24.5 caching disabled
| Defendpoint Component | Mean | Min | Max |
|---|---|---|---|
| CPU % | 2.44556896 | 0 | 10.4 |
| Memory (mb) | 12.8003314 | 8.578 | 19 |
| Energy Impact | 2.44556896 | 0 | 10.4 |
| Endpoint Security Component | Mean | Min | Max |
|---|---|---|---|
| CPU % | 3.50531527 | 0.9 | 12.9 |
| Memory (mb) | 7.98339708 | 3.089 | 8.29 |
| Energy Impact | 3.50531527 | 0.9 | 12.9 |
| PrivilegeManagement Component | Mean | Min | Max |
|---|---|---|---|
| CPU % | 0.23777315 | 0 | 17.6 |
| Memory (mb) | 17.6498439 | 12 | 47 |
| Energy Impact | 0.23777315 | 0 | 17.6 |
| Interrogator Component | Mean | Min | Max |
|---|---|---|---|
| CPU % | 1.72966805 | 0 | 15.4 |
| Memory (mb) | 83.9830643 | 5.169 | 117 |
| Energy Impact | 1.72966805 | 0 | 15.4 |
EPM-M 24.3 caching disabled
| Defendpoint Component | Mean | Min | Max |
|---|---|---|---|
| CPU % | 2.27095032 | 0 | 7.8 |
| Memory (mb) | 12.6131652 | 8.018 | 18 |
| Energy Impact | 2.27095032 | 0 | 7.8 |
| Endpoint Security Component | Mean | Min | Max |
|---|---|---|---|
| CPU % | 2.79196141 | 0.7 | 11 |
| Memory (mb) | 8.01512594 | 2.977 | 8.386 |
| Energy Impact | 2.79196141 | 0.7 | 11 |
| PrivilegeManagement Component | Mean | Min | Max |
|---|---|---|---|
| CPU % | 0.22316747 | 0 | 17.5 |
| Memory (mb) | 22.9058026 | 4.945 | 50 |
| Energy Impact | 0.22316747 | 0 | 17.5 |
| Interrogator Component | Mean | Min | Max |
|---|---|---|---|
| CPU % | 1.66139883 | 0 | 14 |
| Memory (mb) | 83.1811671 | 5.922 | 117 |
| Energy Impact | 1.66139883 | 0 | 14 |
Installing and building Qt5 from source with a QuickStart High Flexibility policy applied
Hyperfine --runs 10 'HOMEBREW_NO_AUTO=1 brew reinstall qt@5'| Test/version | Mean(sec) | Min(sec) | Max(sec) |
|---|---|---|---|
| 24.5 with Caching Disabled | 38.247 s ± 0.557 s [User: 6.170 s, System: 16.760 s] | 37.401 s | 39.142 s |
| 24.3 with Caching Enabled | 30.048 s ± 0.567 s [User: 6.252 s, System: 16.721 s] | 29.358 s | 31.233 s |
| 24.3 with Caching Disabled | 37.156 s ± 0.300 s [User: 6.155 s, System: 16.749 s] | 36.636 s | 37.571 s |
| 24.5 with Caching Enabled | 30.460 s ± 0.274 s [User: 6.333 s, System: 16.923 s] | 30.145 s | 30.924 s |
| No EPM-M installed | 56.466 s ± 29.484 s [User: 14.027 s, System: 26.076 s] | 46.478 s | 140.366 s |
24.3 report
The aim of this document is to provide data on agreed performance metrics of the EPM-M desktop client compared to the previous release.
The content of this document should be used to provide general guidance only. The are many different factors in a live environment which could show different results such as hardware configuration, macOS configuration and background activities, 3rd party products, and the nature of the EPM policy being used.
Performance benchmarking
Test scenario
The tests were ran on a Parallels virtual machine with the following configuration:
- macOS: 13.4.1
- Apple Silicon
- 8GB RAM
Tests were completed with the GA releases.
- 24.1
- 24.3
Test names
- Quick Start policy in High flex, admin user
- Running the Automation Tests Suite with a Monitoring tool
- Installing and building Qt5 from source
Test method
We have included three methods to test our product, all make use of the caching feature.
There were three types of tests conducted:
- The first one uses the default quick start policy where we expect to match on an allowed binary with no dialog presented to the user, ensuring consistency and reducing user interaction.
The Quick Start policy is the policy that's most commonly used as a base for all of our customers. It can be applied by the MMC and WPE with Import Template. It was chosen as it's our most common use case. The binary we're launching is bash with the -help argument, and we run it through the hyperfine tool during the test process to produce the minimum, maximum and mean time of our rule matching engine.
- The next one involves running our Automation Tests Suite and measuring the components resource consumption. We conduct tests on all of our core functionality with our automation suite and keep our software under load for approximately an hour. We’ve used the Automation Tests Suite to portray as close as possible a real life environment usage and to monitor EPM-M through all types of intensive and non intensive scenarios.
- The last one is about installing the Qt5 package on the system and building it from source to simulate a developer environment trying to set it up and compile code. We use the hyperfine tool to run the 'HOMEBREW_NO_AUTO=1 brew reinstall qt@5' command which executes it 10 times in a row and times the minimum and maximum in seconds for each run, also producing the mean values.
Summary
Comparing 24.1 results against 24.3, we can observe no major differences between these two builds when caching is disabled but there is a 10-15% improvement when caching is enabled. This is due to a new performance improvement feature that introduces caching for file reads on the system.
The tests were done at a micro level focusing on a single binary and at a macro level focusing on multiple binaries being run while installing and building from source.
Overall there is no performance degradation and the resource consumption differences between the automation runs are negligible, with a substantial performance improvement when caching is enabled.
Results
Rule matching latency
Hyperfine v1.18 used both 24.1 and 24.3 for the results of tests 1 and 3.
| Test/version | Mean | Min | Max |
|---|---|---|---|
| 24.1 Process Matching Rule Latency No Caching | 4.6 ms ± 1.0 ms | 2.1 ms | 11.2 ms |
| 24.3 Process Matching Rule Latency No Caching | 2.4 ms ± 0.9 ms | 0.8 ms | 7.0 ms |
| 24.1 Process Matching Rule Latency With Caching | 1.2 ms ± 0.4 ms | 0.6 ms | 2.9 ms |
| 24.3 Process Matching Rule Latency With Caching | 1.1 ms ± 0.3 ms | 0.6 ms | 2.2 ms |
| No EPM-M installed | 925.2 µs ± 332.6 µs | 390.1 µs | 2742.0 µs |
µs is microsecond. ms is millisecond.
We’ve included a visualization of the resources our components are using when running the following command on the 24.1 release candidate with caching disabled:
Hyperfine --runs 1000 'bash -help'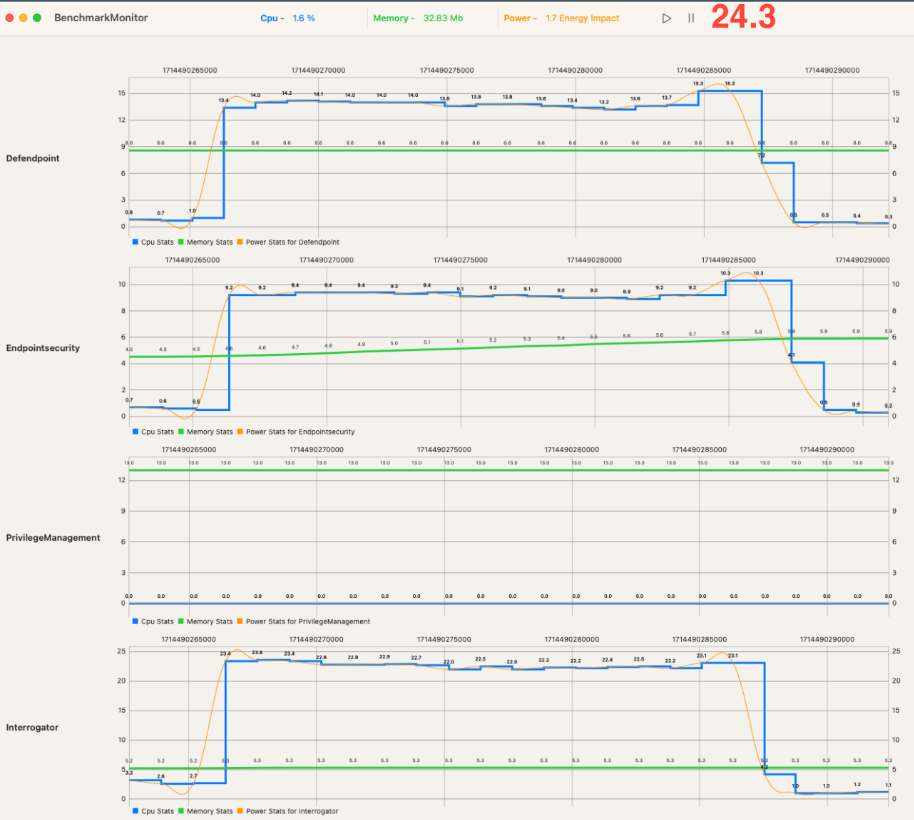
This shows how our components under load using the command and for a short time after, which is due to our components needing additional time to fully compute the 1000 actions in this test case.
All resources drop to near zero after that.
Automation tests resource consumption per component
Defendpoint component
Process load ( % )
| Test/version | Mean | Min | Max |
|---|---|---|---|
| 24.3 | 0.56 | 0 | 5.3 |
| 24.1 | 0.378 | 0 | 5.6 |
Memory (MB)
| Test/version | Mean | Min | Max |
|---|---|---|---|
| 24.3 | 10.123 | 6.194 | 16 |
| 24.1 | 10.454 | 5.825 | 16 |
Energy Impact
| Test/version | Mean | Min | Max |
|---|---|---|---|
| 24.3 | 0.569 | 0 | 5.3 |
| 24.1 | 0.378 | 0 | 5.6 |
PrivilegeManagement component
Process load ( % )
| Test/version | Mean | Min | Max |
|---|---|---|---|
| 24.3 | 0.032 | 0 | 0.9 |
| 24.1 | 0.020 | 0 | 9.1 |
Memory (MB)
| Test/version | Mean | Min | Max |
|---|---|---|---|
| 24.3 | 9.998 | 9.906 | 10 |
| 24.1 | 10.340 | 9.586 | 32 |
Energy impact
| Test/version | Mean | Min | Max |
|---|---|---|---|
| 24.3 | 0.053 | 0 | 2.7 |
| 24.1 | 0.0295 | 0 | 9.3 |
EndpointSecurity component
Process load ( % )
| Test/version | Mean | Min | Max |
|---|---|---|---|
| 24.3 | 0.522 | 0 | 9.5 |
| 24.1 | 0.405 | 0 | 2.9 |
Memory (MB)
| Test/version | Mean | Min | Max |
|---|---|---|---|
| 24.3 | 6.182 | 4.401 | 6.273 |
| 24.1 | 5.736 | 4.353 | 6.081 |
Energy impact
| Test/version | Mean | Min | Max |
|---|---|---|---|
| 24.3 | 0.554 | 0 | 9.5 |
| 24.1 | 0.433 | 0 | 2.9 |
Interrogator Component
Process load ( % )
| Test/version | Mean | Min | Max |
|---|---|---|---|
| 24.3 | 0.987 | 0 | 7.5 |
| 24.1 | 0.465 | 0 | 5.7 |
Memory (MB)
| Test/version | Mean | Min | Max |
|---|---|---|---|
| 24.3 | 116.236 | 6.865 | 148 |
| 24.1 | 107.954 | 4.898 | 137 |
Energy impact
| Test/version | Mean | Min | Max |
|---|---|---|---|
| 24.3 | 0.988 | 0 | 7.5 |
| 24.1 | 0.465 | 0 | 5.7 |
Install and build Qt5 from source with a QuickStart high flexibility policy applied
Hyperfine --runs 10 'HOMEBREW_NO_AUTO=1 brew reinstall qt@5'| Test/version | Mean(sec) | Min(sec) | Max(sec) |
|---|---|---|---|
| 23.9.1 with Caching Disabled | 36.242 ± 0.317 | 35.715 | 36.631 |
| 24.1 with Caching Disabled | 39.747 ± 0.765 | 38.058 | 40.558 |
| 24.3 with Caching Disabled | 40.563 s ± 1.406 s | 38.542 s | 43.180 s |
| 23.9.1 with Caching Enabled | 29.470 ± 0.408 | 28.890 | 30.342 |
| 24.1 with Caching Enabled | 35.653 s ± 1.002 s | 33.657 | 36.570 |
| 24.3 with Caching Enabled | 35.521 s ± 0.893 s | 33.701 s | 36.668 s |
| No EPM-M installed | 26.607 s ± 0.845 s | 25.385 | 28.556 |
24.1 report
The aim of this document is to provide data on agreed performance metrics of the EPM-M desktop client compared to the previous release.
The content of this document should be used to provide general guidance only. The are many different factors in a live environment which could show different results such as hardware configuration, macOS configuration and background activities, 3rd party products, and the nature of the EPM policy being used.
Performance benchmarking
Test scenario
The tests were ran on an Parallels virtual machine with the following configuration:
- macOS: 13.4.1
- Apple Silicon
- 8GB RAM
Tests were completed with the GA releases.
- 23.9.1.1
- 24.1
Test names
- Quick Start policy in High flex, admin user
- Running the Automation Tests Suite with a Monitoring tool
- Installing and building Qt5 from source
Test method
We have included three methods to test our product, all make use of the caching feature.
There were three types of tests conducted:
- The first one uses the default quick start policy where we expect to match on an allowed binary with no dialog presented to the user, ensuring consistency and reducing user interaction.
The quick start policy is the policy that's most commonly used as a base for all of our customers. It can be applied by the MMC and WPE with Import Template. It was chosen as it's our most common use case. The binary we're launching is bash with the -help argument, and we run it through the hyperfine tool during the test process to produce the minimum, maximum and mean time of our rule matching engine.
- The next one involves running our Automation Tests Suite and measuring the components resource consumption. We conduct tests on all of our core functionality with our automation suite and keep our software under load for approximately an hour. We’ve used the Automation Tests Suite to portray as close as possible a real life environment usage and to monitor PMfM through all types of intensive and non intensive scenarios.
- The last one is about installing the Qt5 package on the system and building it from source to simulate a developer environment trying to set it up and compile code. We use the hyperfine tool to run the 'HOMEBREW_NO_AUTO=1 brew reinstall qt@5' command which executes it 10 times in a row and times the minimum and maximum in seconds for each run, also producing the mean values.
Summary
Comparing 23.9.1 results against 24.1, we can observe no major differences between these two builds when caching is disabled but there is a 10-15% improvement when caching is enabled. This is due to a new performance improvement feature that introduces caching for file reads on the system.
The tests were done at a micro level focusing on a single binary and at a macro level focusing on multiple binaries being run while installing and building from source.
Overall there is no performance degradation and the resource consumption differences between the automation runs are negligible, with a substantial performance improvement when caching is enabled.
Results
Rule matching latency
Note: Hyperfine v1.18. used both 23.9.1 and 24.1 for the results of tests 1 and 3.
| Test/version | Mean | Min | Max |
|---|---|---|---|
| 23.9.1 Process Matching Rule Latency No Caching | 4.6 ms ± 1.8 ms | 3.4 | 10.1 |
| 24.1 Process Matching Rule Latency No Caching | 4.6 ms ± 1.0 ms | 2.1 ms | 11.2 ms |
| 23.9.1 Process Matching Rule Latency With Caching | 615.8 µs ± 323.3 µs | 209.1 µs | 1888.5 µs |
| 24.1 Process Matching Rule Latency With Caching | 1.2 ms ± 0.4 ms | 0.6 ms | 2.9 ms |
| No EPM-M installed | 965.3 µs ± 338.9 µs | 468.2 µs | 2245.1 µs |
µs is microsecond. ms is millisecond.
We’ve included a visualization of the resources our components are using when running the following command on the 24.1 release candidate with caching disabled:
Hyperfine --runs 1000 'bash -help'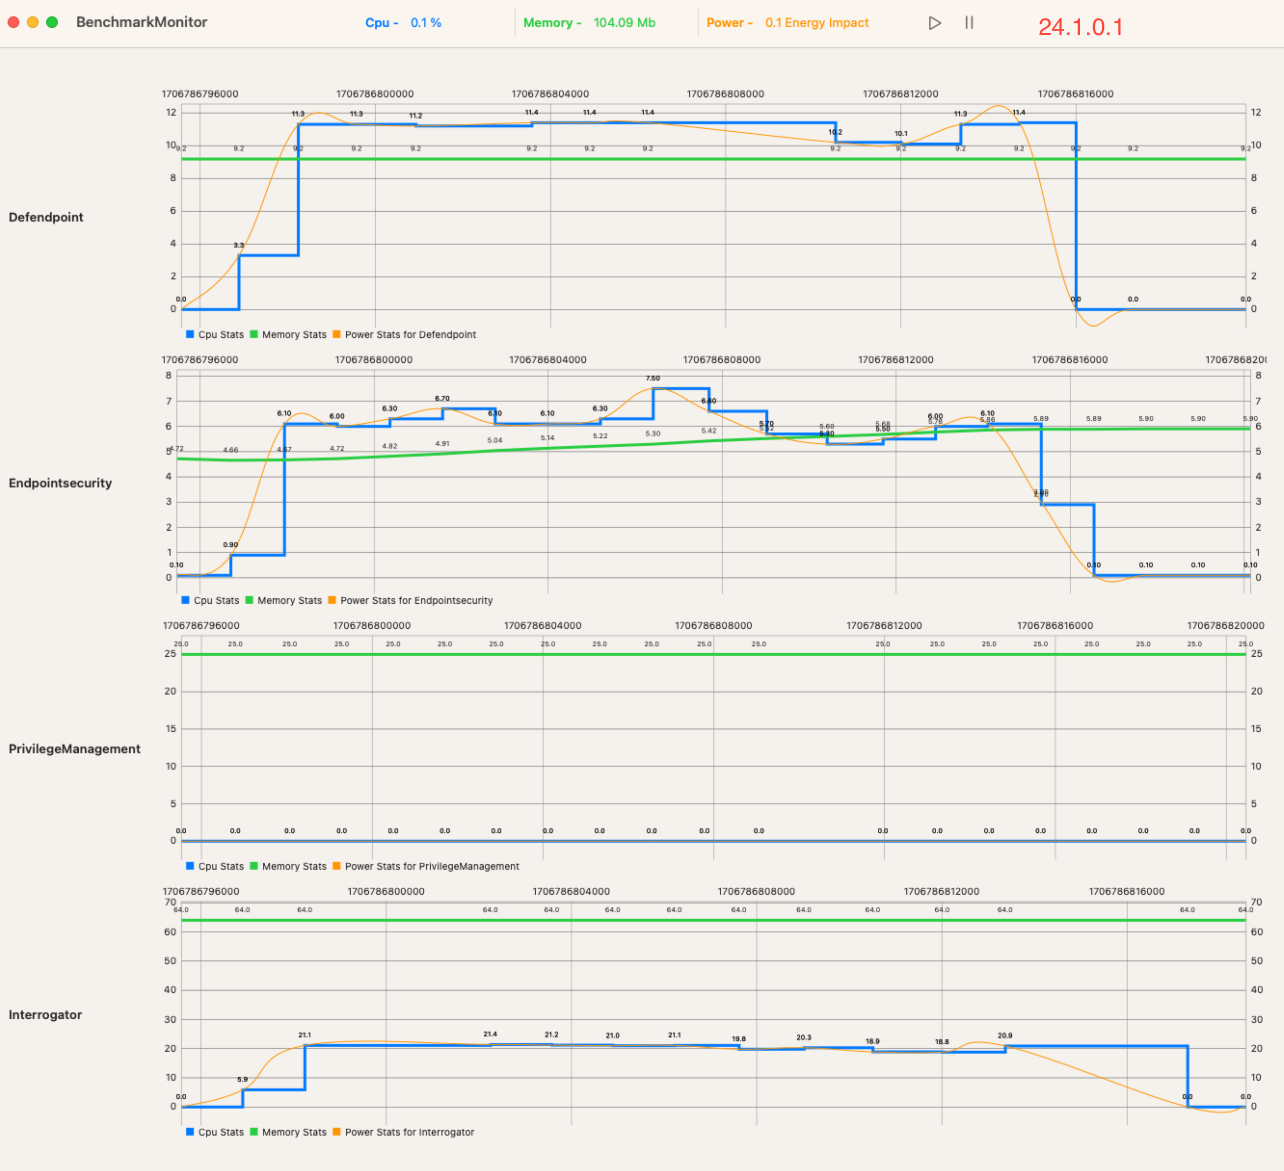
This shows how our components under load using the command and for a short time after, which is due to our components needing additional time to fully compute the 1000 actions in this test case.
All resources drop to near zero after that.
Automation tests resource consumption per component
Defendpoint component
Process load ( % )
| Test/version | Mean | Min | Max |
|---|---|---|---|
| 24.1 | 0.378 | 0 | 5.6 |
| 23.9.1 | 1.162 | 0 | 11.8 |
| 23.9 | 0.785 | 0 | 7.4 |
Memory (MB)
| Test/version | Mean | Min | Max |
|---|---|---|---|
| 24.1 | 10.454 | 5.825 | 16 |
| 23.9.1 | 9.778 | 5.537 | 14 |
| 23.9 | 8.937 | 5.537 | 12 |
Energy impact
| Test/version | Mean | Min | Max |
|---|---|---|---|
| 24.1 | 0.378 | 0 | 5.6 |
| 23.9.1 | 1.163 | 0 | 11.8 |
| 23.9 | 0.788 | 0 | 9.3 |
PrivilegeManagement component
Process load ( % )
| Test/version | Mean | Min | Max |
|---|---|---|---|
| 24.1 | 0.020 | 0 | 9.1 |
| 23.9.1 | 0.513 | 0 | 10.1 |
| 23.9 | 0.575 | 0 | 17.5 |
Memory (MB)
| Test/version | Mean | Min | Max |
|---|---|---|---|
| 24.1 | 10.340 | 9.586 | 32 |
| 23.9.1 | 8.340 | 4.497 | 14 |
| 23.9 | 28.259 | 4.897 | 35 |
Energy impact
| Test/version | Mean | Min | Max |
|---|---|---|---|
| 24.1 | 0.0295 | 0 | 9.3 |
| 23.9.1 | 0.528 | 0 | 10.1 |
| 23.9 | 0.787 | 0 | 17.9 |
EndpointSecurity component
Process load ( % )
| Test/version | Mean | Min | Max |
|---|---|---|---|
| 24.1 | 0.405 | 0 | 2.9 |
| 23.9.1 | 1.046 | 0 | 10.1 |
| 23.9 | 0.936 | 0 | 16.7 |
Memory (MB)
| Test/version | Mean | Min | Max |
|---|---|---|---|
| 24.1 | 5.736 | 4.353 | 6.081 |
| 23.9.1 | 5.990 | 4.497 | 6.161 |
| 23.9 | 5.571 | 4.433 | 5.665 |
Energy impact
| Test/version | Mean | Min | Max |
|---|---|---|---|
| 24.1 | 0.433 | 0 | 2.9 |
| 23.9.1 | 1.095 | 0 | 10.1 |
| 23.9 | 0.979 | 0 | 16.7 |
Interrogator component
Process load ( % )
| Test/version | Mean | Min | Max |
|---|---|---|---|
| 24.1 | 0.465 | 0 | 5.7 |
| 23.9.1 | 3.517 | 0 | 28.6 |
| 23.9 | 2.149 | 0 | 19.8 |
Memory (MB)
| Test/version | Mean | Min | Max |
|---|---|---|---|
| 24.1 | 107.954 | 4.898 | 137 |
| 23.9.1 | 98.365 | 7.665 | 134 |
| 23.9 | 107.904 | 6.097 | 143 |
Energy impact
| Test/version | Mean | Min | Max |
|---|---|---|---|
| 24.1 | 0.465 | 0 | 5.7 |
| 23.9.1 | 3.517 | 0 | 28.6 |
| 23.9 | 2.149 | 0 | 19.8 |
Install and build Qt5 from source with a QuickStart high flexibility policy applied
Hyperfine --runs 10 'HOMEBREW_NO_AUTO=1 brew reinstall qt@5'| Test/version | Mean(sec) | Min(sec) | Max(sec) |
|---|---|---|---|
| 23.9.1 with Caching Disabled | 36.242 ± 0.317 | 35.715 | 36.631 |
| 24.1 with Caching Disabled | 39.747 ± 0.765 | 38.058 | 40.558 |
| 23.9.1 with Caching Enabled | 29.470 ± 0.408 | 28.890 | 30.342 |
| 24.1 with Caching Enabled | 35.653 s ± 1.002 s | 33.657 | 36.570 |
| No EPM-M installed | 27.226 s ± 0.807 s | 25.804 | 28.146 |