Analytics | EPM-WM Cloud
What are analytics?
Analytics displays at-a-glance reporting metrics for all of your endpoints' events, applications, and user actions.
How are they useful?
Use your analytics pages to understand and take action on your security posture in EPM-WM.
A standard user requires delegated access to this feature. For more information, see About user types and resources.
When you want policy administrators to see events only for the computer groups they manage, create a user and select Standard User. From the Computer Groups list, select Analyze Group.
The Dashboard page
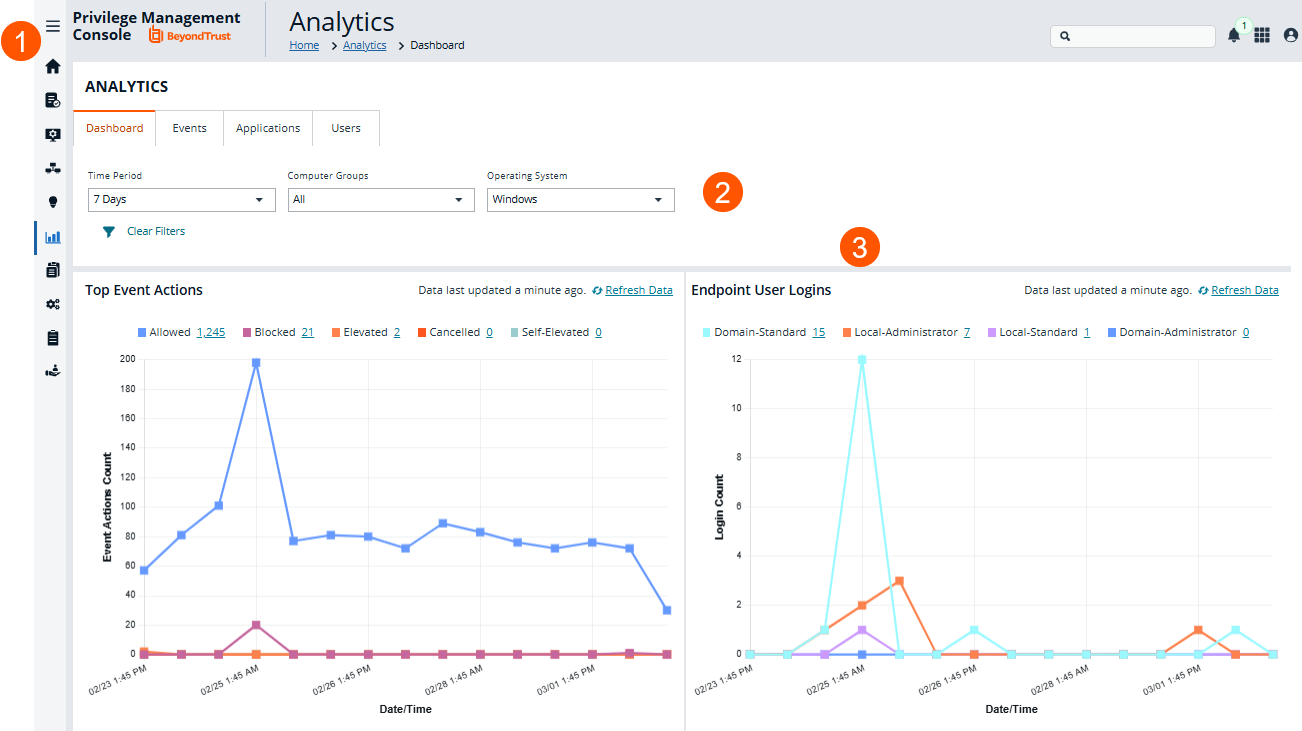
- Left menu: Easy access to all pages in Endpoint Privilege Management, including the Home, Policies, Computers, Computer Groups, Management Rules, Analytics, Just-in-Time Access Management, Configuration, Auditing, and User Management pages.
- Filters: Select a filter to refine your results. Click Clear Filters to remove all filters from your results.
- Data charts: There are three data charts on the Dashboard page.
- Top Event Actions chart: Your tracked event actions. For detailed information about the actions, click the linked number on the chart to open the Events page.
- Tracked Windows actions: Allowed, Elevated, Cancelled, Self-Elevated, and Blocked
- Tracked macOS actions: Allowed, Allowed Installable, Allowed Deletable, Blocked, Cancelled, and Passive
- Endpoint User Logins chart: The total active Windows users who logged into your estate.
- Tracked users: Local Administrator, Domain Standard, Local Standard, and Domain Administrator
- Application Requests chart: The total number of application requests, approvals, and denials.
- Top Event Actions chart: Your tracked event actions. For detailed information about the actions, click the linked number on the chart to open the Events page.
Use cases
The use cases provide guidance on how to manage and interpret the results of the data gathered by Analytics.
Generate views
Additional Analytics features you can use when generating the data:
- After setting the filters, save the view to load the same set of filters the next time you want to refresh the data.
- Add the applications to policy using the Add to Policy option.
Windows
| Use Case | Filters |
|---|---|
| Learn about recent events that require admin rights in your estate and add them to your Add Admin Application Groups. | On the Events grid with these filters:
|
| Learn about recent on-demand elevation events in your estate, and add them to Add Admin Application Groups. | On the Events grid with these filters:
|
| Learn about the most popular applications that require admin rights in your estate, and add them to your Add Admin Application Groups. | On the Applications grid with these filters:
|
| Learn about the most popular applications that are elevated on demand in your estate, and add them to your Add Admin Application Groups. | On the Applications grid with these filters:
|
| To see the most popular passive applications that would have been blocked if the Low Flexibility policy was enabled, and add those to the Low Flex - Passive list before enabling the active allow list. | On the Applications grid with these filters:
|
macOS
| Use Case | Favorite Filters |
|---|---|
| Learn about recent events that require authorization rights in your estate, and add them to Add Admin Application Groups. | On the Events grid with these filters:
|
| Learn about the most popular applications that require authorization in your estate, and add them to your Authorize Application Groups. | On the Applications grid with these filters:
|
| To see the most popular passive applications that would have been blocked if the Low Flexibility policy was enabled, and add those to the Low Flex - Passive list before enabling the active allow list. | On the Applications grid with these filters:
|
Updated 1 day ago