EPM for Windows performance reports | EPM-WM
26.2 report
The aim of this document is to provide data on agreed performance metrics of the Privilege Management for Windows desktop client compared to the previous release.
The content of this document should be used to provide general guidance only. The are many different factors in a live environment which could show different results such as hardware configuration, Windows configuration and background activities, 3rd party products, and the nature of the EPM policy being used.
Performance benchmarking
Test Scenario
Tests are performed on dedicated VMs hosted in our datacenter. Each VM is configured with:
- Windows 10 21H2
- 4 Core 3.3GHz CPU
- 8GB Ram
Testing was performed using the GA release of 23.NEW.
Test Name
Quick Start policy with single matching rule
Test Method
This test involves a modified Quick Start policy where a single matching rule is added which auto elevates an application based on its name. Auditing is also turned on for the application. The application is trivial command line app and is executed once per second for 60 minutes. Performance counters and PMfW activity logging are collected and recorded by the test.
The Quick Start policy is commonly used as a base for all of our customers and it can be applied using our Policy Editor Import Template function. It was chosen as it's our most common use case. The application being elevated is a dummy application exe, which we've created specifically for this testing and it terminates quickly and doesn't have a UI, making it ideal for the testing scenario.
Results
Listed below are the results from the runs of the tests on 23.NEW and our previous release, 23.OLD. Due to the nature of our product, we are very sensitive to the OS and general computer activity, so some fluctuation is to be expected.
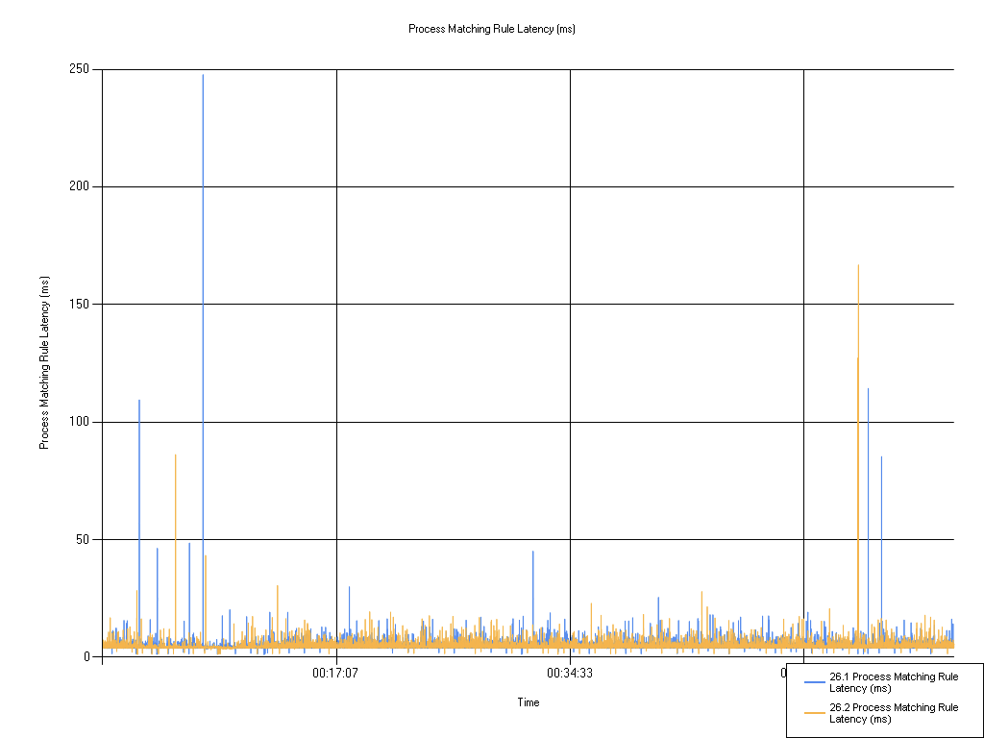
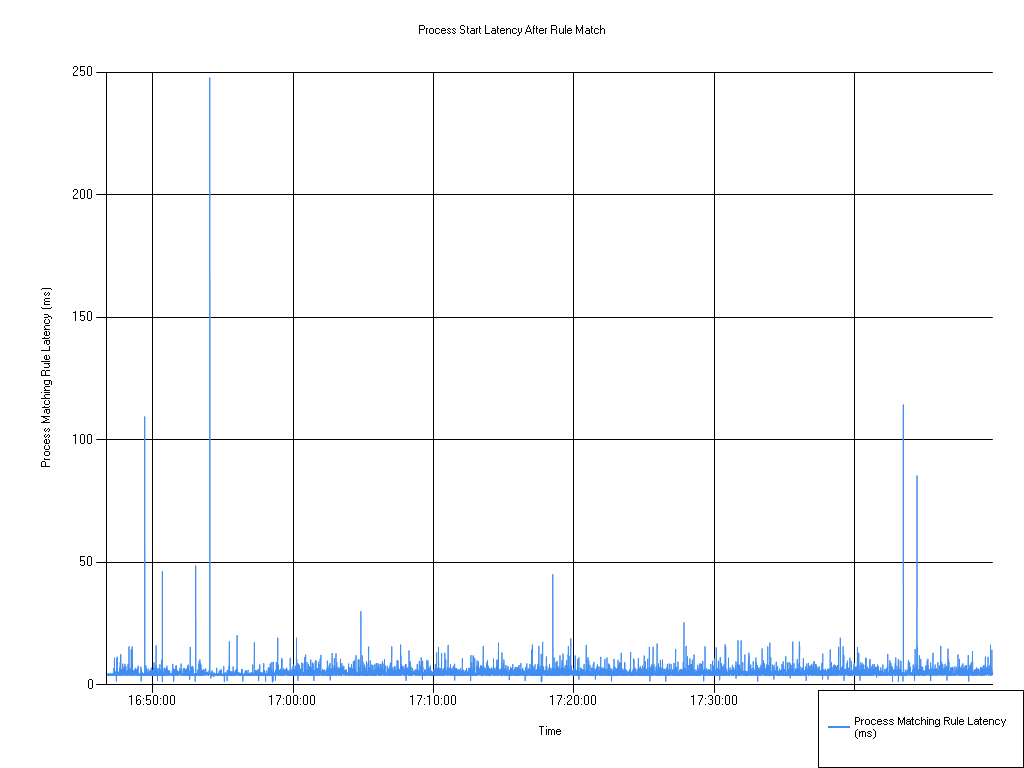
Rule matching latency
Shows the time taken for the rule to match.
| Test/version | Mean | Min | Max |
|---|---|---|---|
| 26.2 Process Matching Rule Latency (ms) | 5.14 | 1.20 | 247.69 |
| 26.1 Process Matching Rule Latency (ms) | 5.15 | 1.13 | 166.78 |
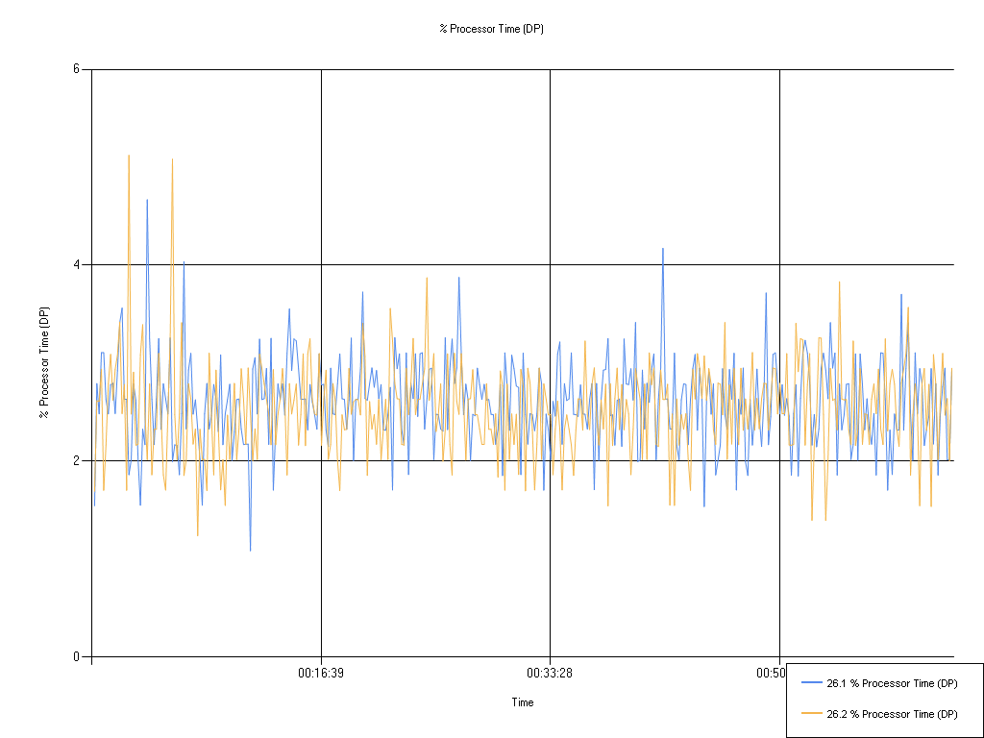
Processor time (Defendpoint)
Percentage of processor time used by the Defendpoint service.
| Test/version | Mean | Min | Max |
|---|---|---|---|
| 26.2 % Processor Time (DP) | 2.53 | 1.24 | 5.12 |
| 26.1 % Processor Time (DP) | 2.61 | 1.09 | 4.67 |
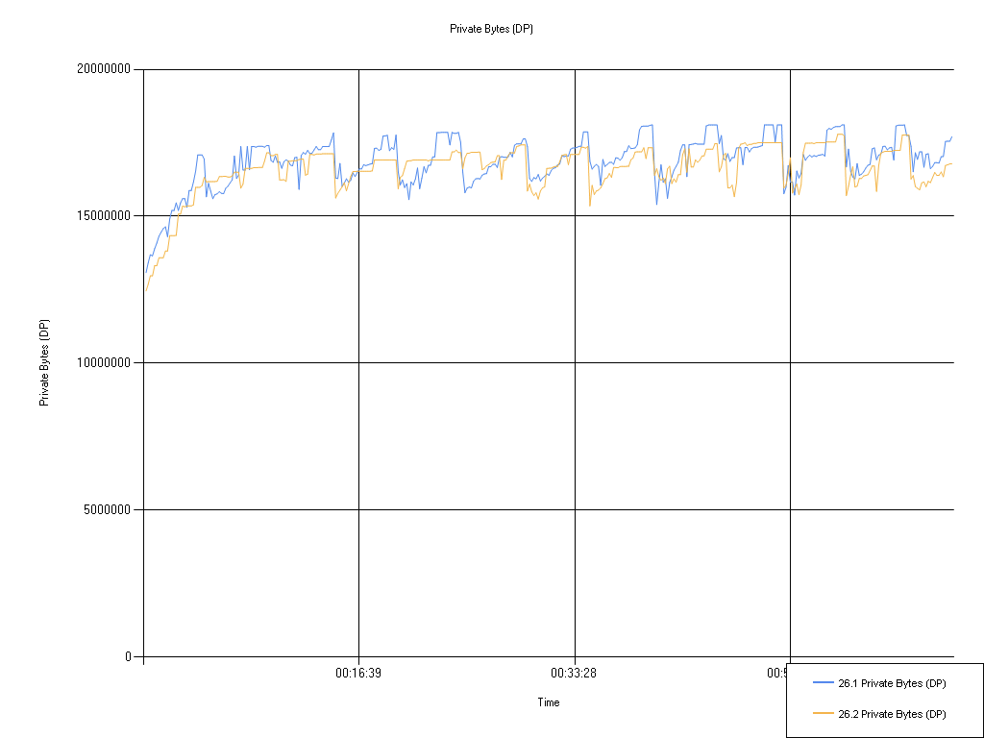
Private Bytes (Defendpoint)
Shows the whole size of the memory consumed by the Defendpoint process.
| Test/version | Mean (MB) | Min (MB) | Max (MB) |
|---|---|---|---|
| 26.2 Private Bytes (DP) | 16.61 | 12.46 | 17.79 |
| 26.1 Private Bytes (DP) | 16.87 | 13.08 | 18.11 |
I/O read and write (Defendpoint)
Shows disk I/O used by the Defendpoint service.
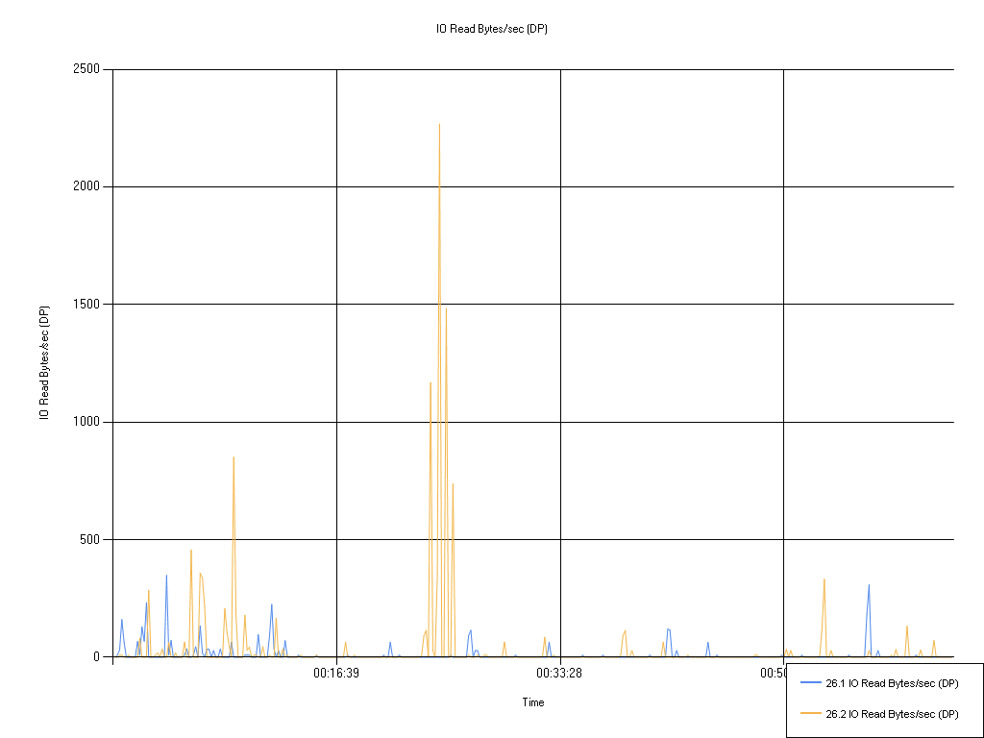
Note: There's more IO here, but it was only present on one of the three policies, and 2267bytes/second is only 2.2KB, next to nothing.
| Test/version | Mean | Min | Max |
|---|---|---|---|
| 26.2 IO Read Bytes/sec (DP) | 31.04 | 0.00 | 2267 |
| 26.1 IO Read Bytes/sec (DP) | 9.6 | 0.00 | 348 |
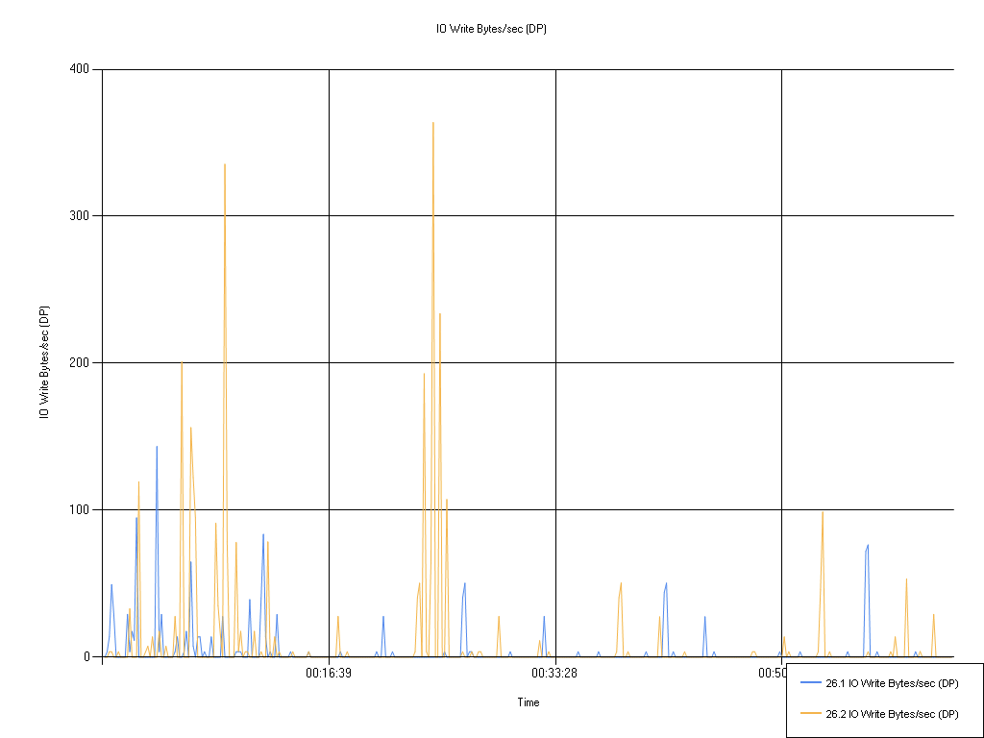
Note: There's more IO here, but it was only present on one of the three policies, and 363bytes/second is next to nothing.
| Test/version | Mean | Min | Max |
|---|---|---|---|
| 26.2 IO Write Bytes/sec (DP) | 8.46 | 0.00 | 363.86 |
| 26.1 IO Write Bytes/sec (DP) | 3.53 | 0.00 | 143.46 |
Memory testing
For each release we run through a series of automation tests (covering Application control, token modification, DLL control and Event auditing) using a build with memory leak analysis enabled to ensure there are no memory leaks. We use Visual Leak Detector (VLD) version 2.51 which when enabled at compile time replaces various memory allocation and deallocation functions to record memory usage. On stopping a service with this functionality an output file is saved to disk, listing all leaks VLD has detected. We use these builds with automation so that an output file is generated for each test scenario within a suite.
The output files are then examined by a developer who will review the results looking for anything notable. Due to the number of automation tests, only suites that test impacted areas are ran, for example EventAuditJson would be ran if a release contained ECS auditing changes. If nothing concerning is found then the build is continued to production.
26.1 report
The aim of this document is to provide data on agreed performance metrics of the Endpoint Privilege Management for Windows (EPM-W) desktop client compared to the previous release.
The content of this document should be used to provide general guidance only. The are many different factors in a live environment which could show different results such as hardware configuration, Windows configuration and background activities, 3rd party products, and the nature of the EPM policy being used.
It should be noted that during the 26.1 release we made a change to our performance benchmark infrastructure and re-ran our benchmark for 25.8 on that platform in addition to testing on 26.1. Since the infrastructure has changed, the results in this report shouldn’t be compared with older benchmarks. It’s a purely N-1 release comparison.
Test Scenario
Tests are performed on dedicated VMs hosted in our datacenter. Each VM is configured with:
- Windows 11 24H2
- 4 Core 3.3GHz CPU
- 8 GB Ram
Testing was performed using the GA release of 26.1.13.0.
Test Name
Quick Start policy with single matching rule
Test Method
This test involves a modified Quick Start policy where a single matching rule is added which auto elevates an application based on its name. Auditing is also turned on for the application. The application is trivial command line app and is executed once per second for 60 minutes. Performance counters and EPM-W activity logging are collected and recorded by the test.
The Quick Start policy is commonly used as a base for all of our customers and it can be applied using our Policy Editor Import Template function. It was chosen as it's our most common use case. The application being elevated is a dummy application exe, which we’ve created specifically for this testing and it terminates quickly and doesn't have a UI, making it ideal for the testing scenario.
Rule matching latency
| Series | Mean | Min | Max |
|---|---|---|---|
| 25.8 Process Matching Rule Latency (ms) | 4.50 | 1.27 | 41.29 |
| 26.1 Process Matching Rule Latency (ms) | 4.69 | 1.13 | 21.22 |
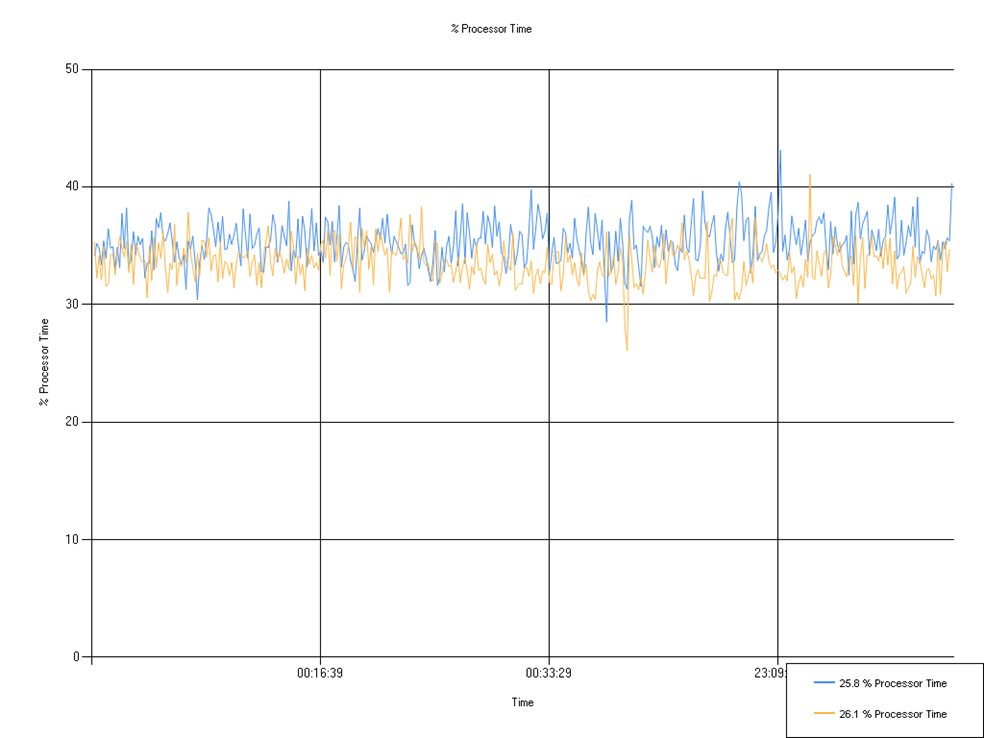
Processor time (Defendpoint)
Percentage of processor time used by the Defendpoint service. Negligible change.
| Series | Mean | Min | Max |
|---|---|---|---|
| 25.8 % Processor Time | 35.37 | 28.52 | 43.10 |
| 26.1 % Processor Time | 33.50 | 26.09 | 41.06 |
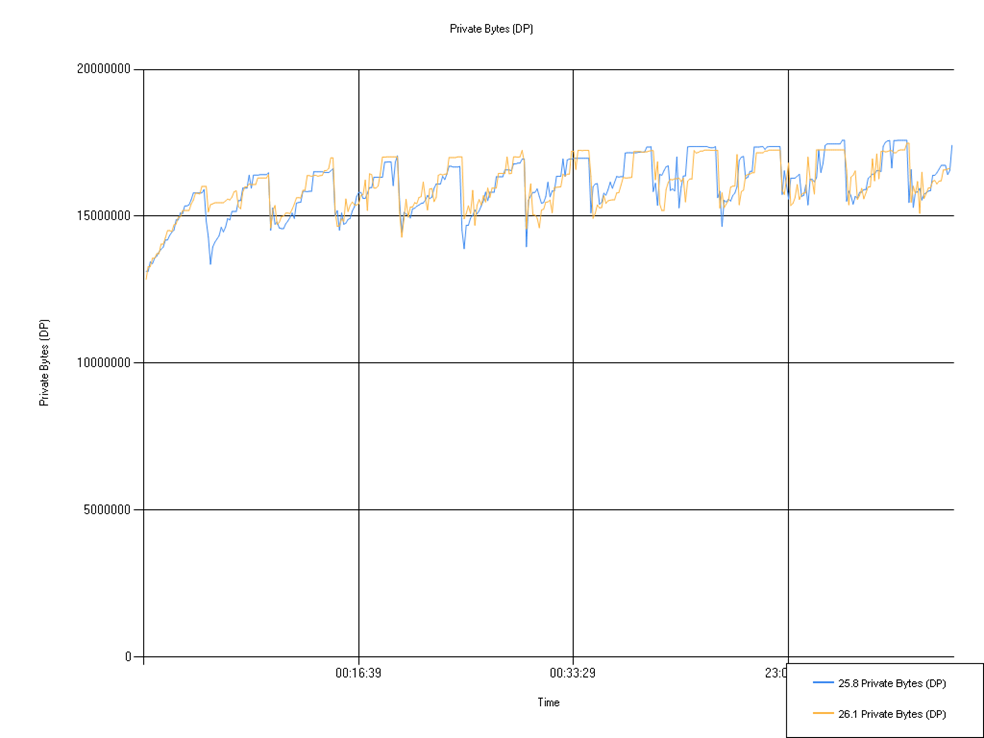
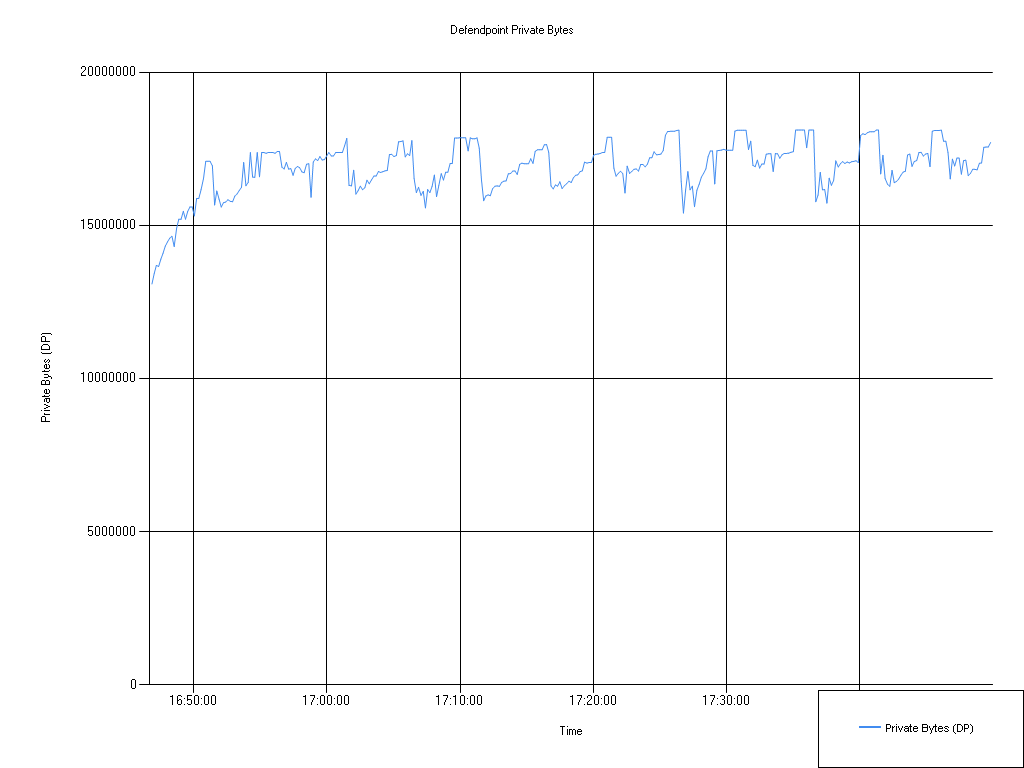
Private bytes (Defendpoint)
| Series | Mean | Min | Max |
|---|---|---|---|
| 25.8 Private Bytes (DP) | 16,053,945.35 | 13,127,680.00 | 17,588,220.00 |
| 26.1 Private Bytes (DP) | 16,073,282.48 | 12,849,150.00 | 17,485,820.00 |
I/O read and write (Defendpoint)
| Series | Mean | Min | Max |
|---|---|---|---|
| 25.8 IO Read Bytes/sec (DP) | 8.72 | 0.00 | 543.42 |
| 26.1 IO Read Bytes/sec (DP) | 6.72 | 0.00 | 542.23 |
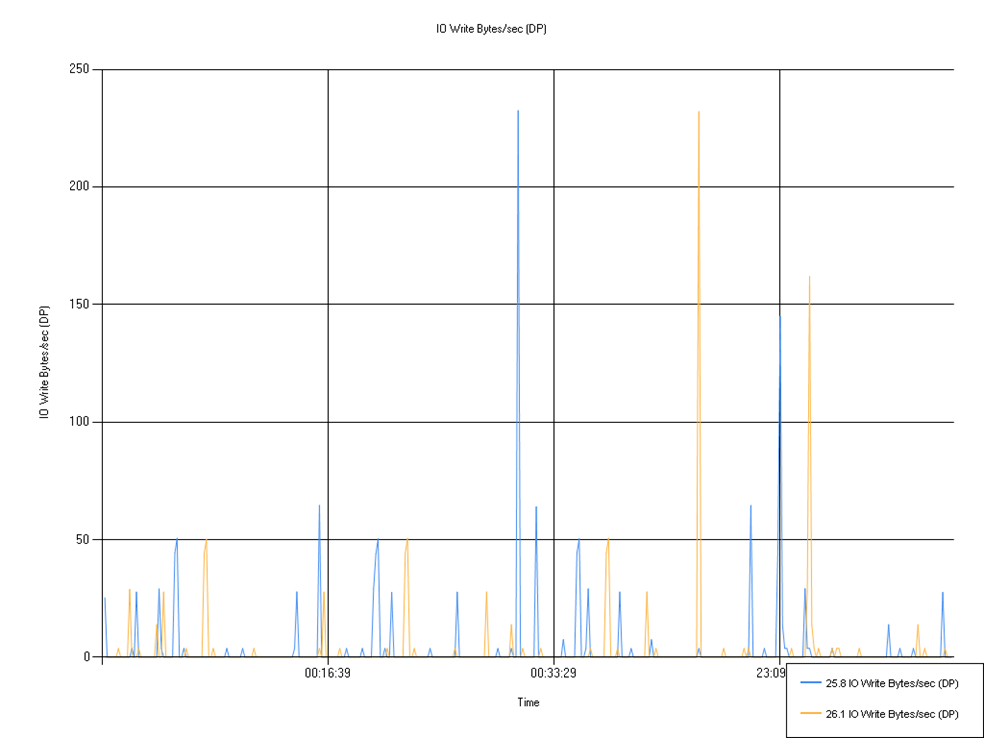
IO write bytes/sec (DefendPoint)
| Series | Mean | Min | Max |
|---|---|---|---|
| 25.8 IO Write Bytes/sec (DP) | 3.57 | 0.00 | 232.50 |
| 26.1 IO Write Bytes/sec (DP) | 2.68 | 0.00 | 232.06 |
Memory testing
For each release we run through a series of automation tests (covering Application control, token modification, DLL control and Event auditing) using a build with memory leak analysis enabled to ensure there are no memory leaks. We use Visual Leak Detector (VLD) version 2.51 which when enabled at compile time replaces various memory allocation and deallocation functions to record memory usage. On stopping a service with this functionality an output file is saved to disk, listing all leaks VLD has detected. We use these builds with automation so that an output file is generated for each test scenario within a suite.
The output files are then examined by a developer who will review the results looking for anything notable. Due to the number of automation tests, only suites that test impacted areas are ran, for example EventAuditJson would be ran if a release contained ECS auditing changes. If nothing concerning is found then the build is continued to production.
25.8 report
The aim of this document is to provide data on agreed performance metrics of the Endpoint Privilege Management for Windows (EPM-W) desktop client compared to the previous release.
The content of this document should be used to provide general guidance only. The are many different factors in a live environment which could show different results such as hardware configuration, Windows configuration and background activities, 3rd party products, and the nature of the EPM policy being used.
It should be noted that during the 25.8 release we upgraded our performance benchmark infrastructure to use Windows 11 24H2 and re-ran our benchmark for 25.4 MR2 on that platform in addition to testing on 25.8. Since the infrastructure has changed, the results in this report shouldn’t be compared with older benchmarks. It’s a purely N-1 release comparison.
Performance benchmarking
Test Scenario
Tests are performed on dedicated VMs hosted in our datacenter. Each VM is configured with:
- Windows 11 24H2
- 4 Core 3.3GHz CPU
- 8GB Ram
Testing was performed using the GA release of 25.8.2.
Test Name
Quick Start policy with single matching rule
Test Method
This test involves a modified Quick Start policy where a single matching rule is added which auto elevates an application based on its name. Auditing is also turned on for the application. The application is trivial command line app and is executed once per second for 60 minutes. Performance counters and EPM-W activity logging are collected and recorded by the test.
The Quick Start policy is commonly used as a base for all of our customers and it can be applied using our Policy Editor Import Template function. It was chosen as it's our most common use case. The application being elevated is a dummy application exe, which we’ve created specifically for this testing and it terminates quickly and doesn't have a UI, making it ideal for the testing scenario.
Results
Listed below are the results from the runs of the tests on 25.8.2 and our previous release, 25.4.287.0. (Note version number increased on 25.4 due to testing infrastructure changes). Due to the nature of our product, we are sensitive to the OS and general computer activity, so some fluctuation is to be expected.
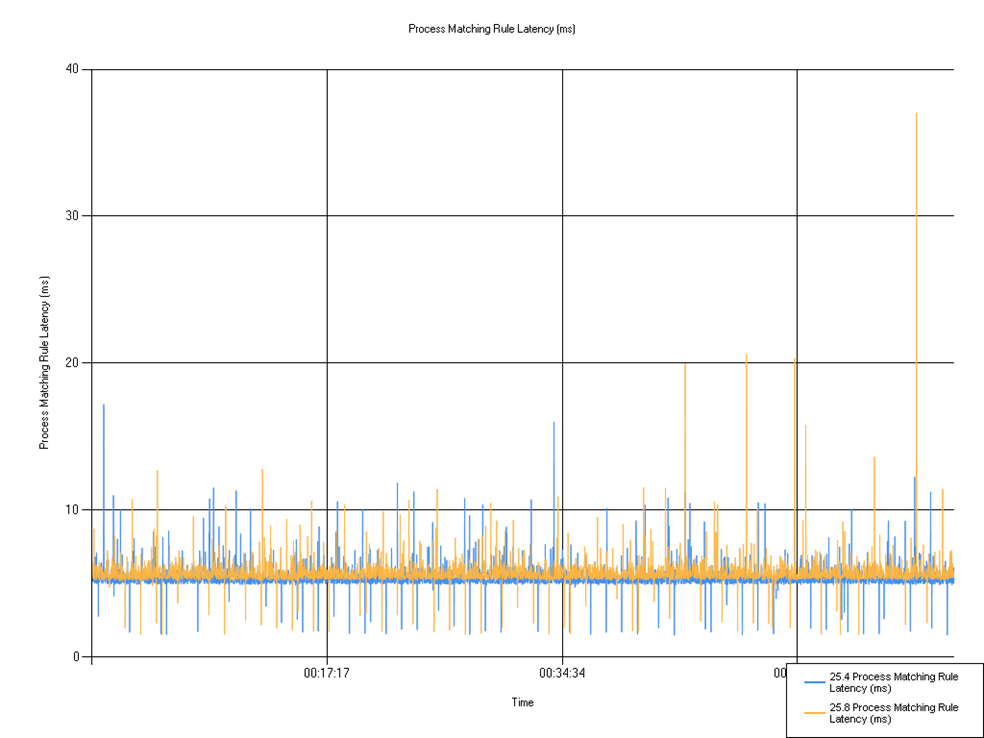
Rule matching latency
Shows the time taken for the rule to match.
Very similar pattern for both versions.
| Series | Mean | Min | Max |
|---|---|---|---|
| 25.4 Process Matching Rule Latency (ms) | 5.42 | 1.51 | 17.19 |
| 25.8 Process Matching Rule Latency (ms) | 5.74 | 1.52 | 37.03 |
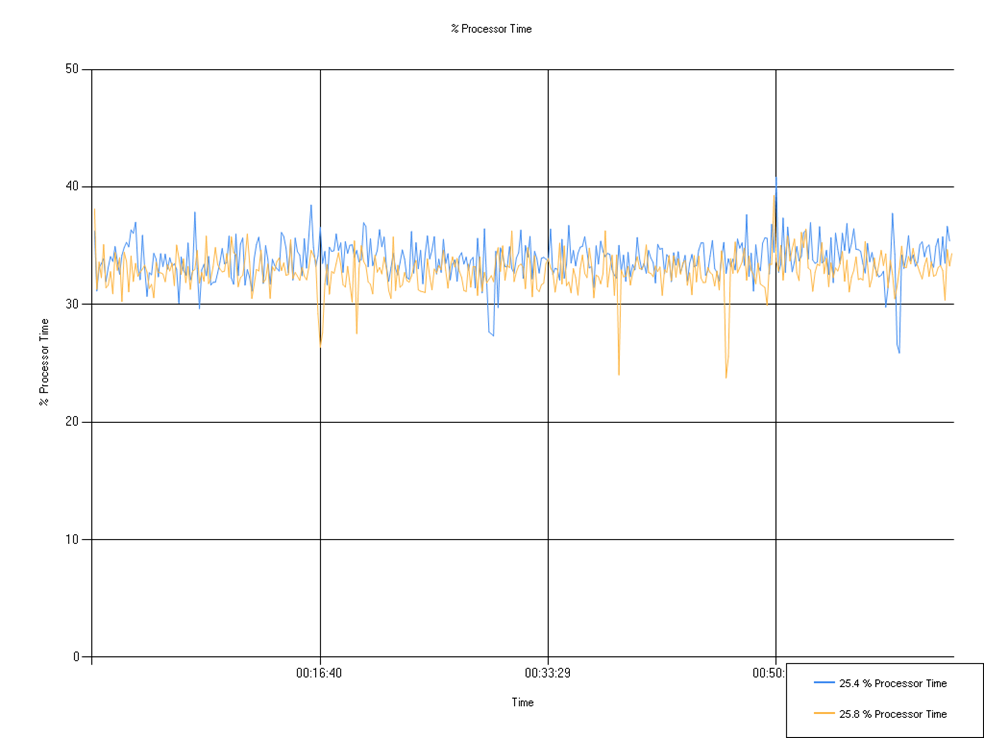
Processor time (Defendpoint)
Percentage of processor time used by the Defendpoint service.
A small but negligible decrease in % Processor time observed for 25.8.
| Series | Mean | Min | Max |
|---|---|---|---|
| 25.4 % Processor Time | 33.87 | 25.87 | 40.83 |
| 25.8 % Processor Time | 32.82 | 23.76 | 39.27 |
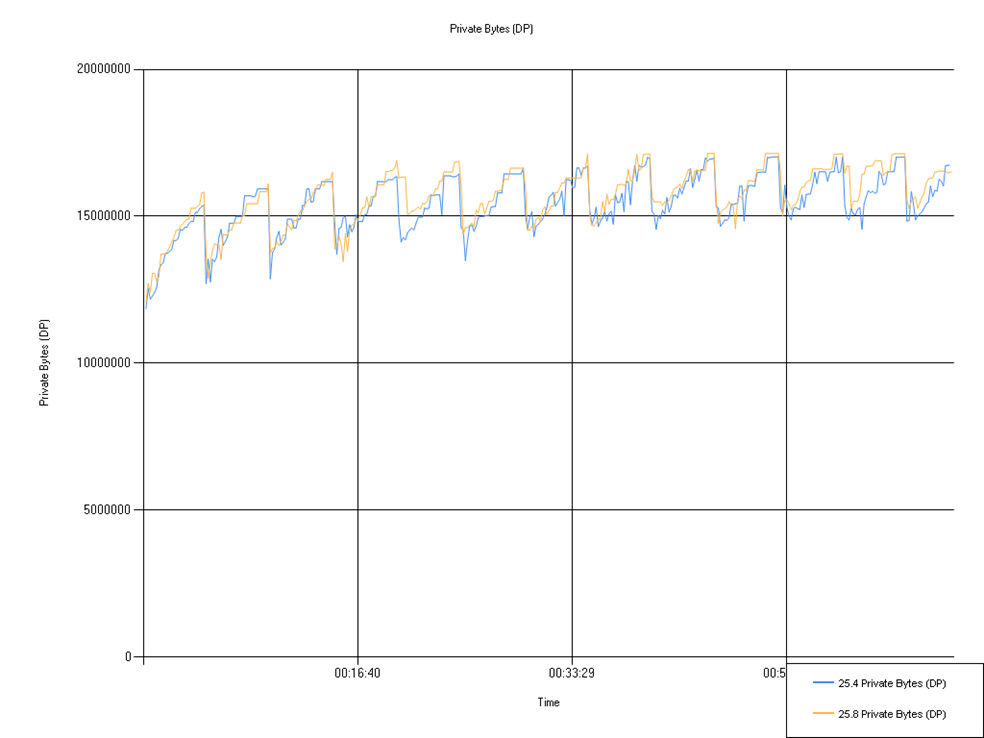
Private Bytes (Defendpoint)
Shows the whole size of the memory consumed by the Defendpoint process. Negligible change.
| Series | Mean | Min | Max |
|---|---|---|---|
| 25.4 Private Bytes (DP) | 15,444,371.30 | 11,857,920.00 | 17,018,880.00 |
| 25.8 Private Bytes (DP) | 15,674,207.72 | 12,091,390.00 | 17,137,660.00 |
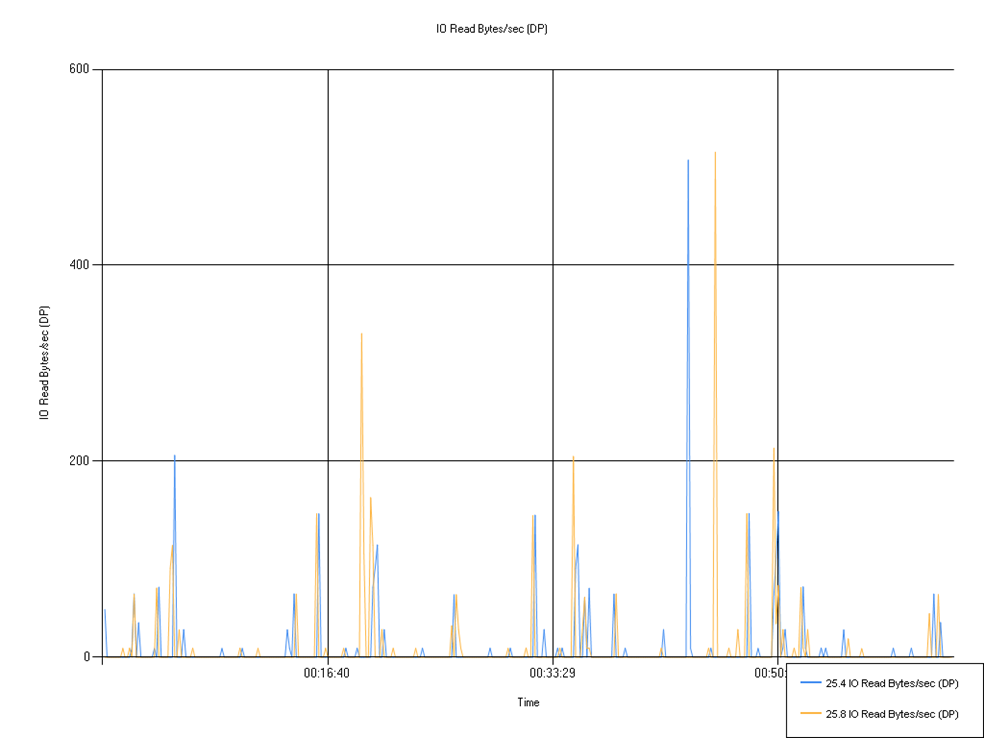
I/O read and write (Defendpoint)
Shows disk I/O used by the Defendpoint service.
No notable patterns visible in graph, though the average overall for 25.4 is higher.
IO Read Bytes/sec (DP)
| Series | Mean | Min | Max |
|---|---|---|---|
| 25.4 IO Read Bytes/sec (DP) | 8.16 | 0.00 | 507.40 |
| 25.8 IO Read Bytes/sec (DP) | 9.05 | 0.00 | 515.50 |
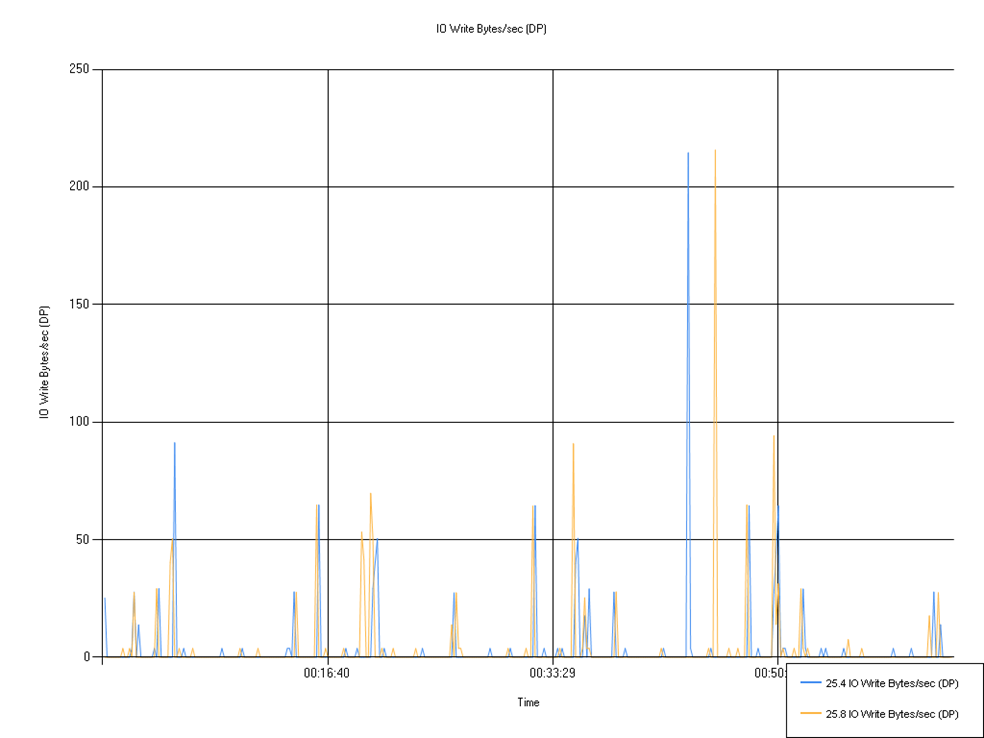
IO Write Bytes/sec (DP)
| Series | Mean | Min | Max |
|---|---|---|---|
| 25.4 IO Write Bytes/sec (DP) | 3.33 | 0.00 | 214.55 |
| 25.8 IO Write Bytes/sec (DP) | 3.48 | 0.00 | 215.71 |
Memory testing
For each release we run through a series of automation tests (covering Application control, token modification, DLL control and Event auditing) using a build with memory leak analysis enabled to ensure there are no memory leaks. We use Visual Leak Detector (VLD) version 2.51 which when enabled at compile time replaces various memory allocation and deallocation functions to record memory usage. On stopping a service with this functionality an output file is saved to disk, listing all leaks VLD has detected. We use these builds with automation so that an output file is generated for each test scenario within a suite.
The output files are then examined by a developer who will review the results looking for anything notable. Due to the number of automation tests, only suites that test impacted areas are ran, for example EventAuditJson would be ran if a release contained ECS auditing changes. If nothing concerning is found then the build is continued to production.
No notable issues found.
25.4 report
The aim of this document is to provide data on agreed performance metrics of the Privilege Management for Windows desktop client compared to the previous release.
The content of this document should be used to provide general guidance only. The are many different factors in a live environment which could show different results such as hardware configuration, Windows configuration and background activities, 3rd party products, and the nature of the EPM policy being used.
Performance benchmarking
Test Scenario
Tests are performed on dedicated VMs hosted in our datacenter. Each VM is configured with:
- Windows 10 22H2
- 4 Core 3.3GHz CPU
- 4GB Ram
Testing was performed using the GA release of 25.4
Test Name
Low Flexibility Quick Start policy with a single matching rule.
Test Method
This test involves a modified Low Flexibility Quick Start policy where a single matching rule is added which auto elevates an application based on its name. Auditing is also turned on for the application. The application is trivial command line app and is executed once per second for 30 minutes. Performance counters and EPM-W activity logging are collected and recorded by the test.
The Quick Start policy is commonly used as a base for all of our customers and it can be applied using our Policy Editor Import Template function. It was chosen as it's our most common use case. The application being elevated is a dummy application exe, which we’ve created specifically for this testing and it terminates quickly and doesn't have a UI, making it ideal for the testing scenario.
Results
Listed below are the results from the runs of the tests on 25.4 and our previous release, 25.2 MR. Due to the nature of our product, we are very sensitive to the OS and general computer activity, so some fluctuation is to be expected.
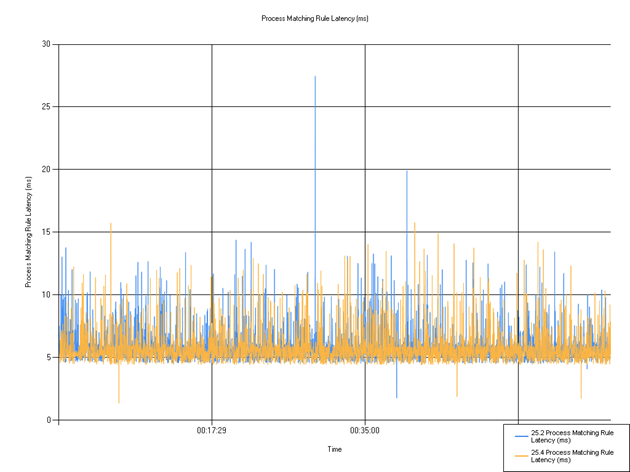
Rule matching latency
Shows the time taken for the rule to match. Some small fluctuations were observed relative to the previous release, but this change in performance should not affect customers in a significant way as it is caused by small variations in the tests that we perform.
| Series | Mean | Min | Max |
|---|---|---|---|
| 25.2 MR Process Matching Rule Latency (ms) | 5.90 | 1.78 | 27.46 |
| 25.4 Process Matching Rule Latency (ms) | 5.78 | 1.37 | 15.78 |
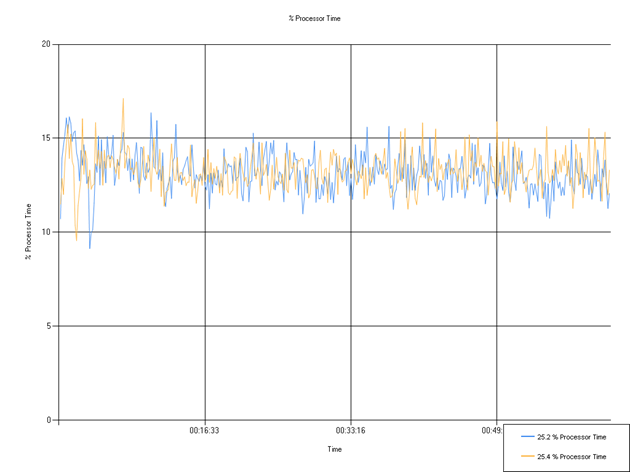
% Processor Time
Percentage of processor time used. The mean percentage remains within <1% of the previous release, suggesting no significant change in processor usage that would impact customer experience.
| Series | Mean | Min | Max |
|---|---|---|---|
| 25.2 MR % Processor Time | 13.15 | 9.14 | 16.36 |
| 25.4 % Processor Time | 13.26 | 9.55 | 17.12 |
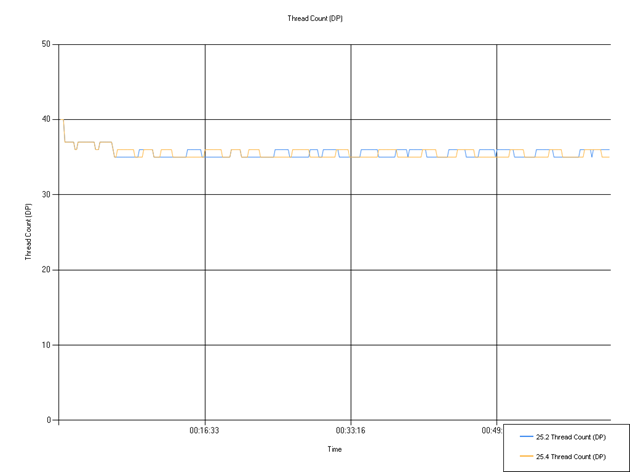
Thread Count (Defendpoint)
Number of threads used by Defendpoint. The mean has fluctuated but not outside our normal error margins for the test, while the minimum and maximum values remained unchanged. This indicates consistent threading behavior with a negligible increase in average usage that is unlikely to impact customer experience.
| Series | Mean | Min | Max |
|---|---|---|---|
| 24.8 Thread Count (DP) | 35.61 | 35.00 | 40.00 |
| 25.2 Thread Count (DP) | 35.58 | 35.00 | 40.00 |
Memory testing
For each release, we run through a series of automation tests (covering Application control, token modification, DLL control and Event auditing) using a build with memory leak analysis enabled to ensure there are no memory leaks. We use Visual Leak Detector (VLD) version 2.51 which when enabled at compile time replaces various memory allocation and deallocation functions to record memory usage. On stopping a service with this functionality an output file is saved to disk, listing all leaks VLD has detected. We use these builds with automation so that an output file is generated for each test scenario within a suite.
The output files are then examined by a developer who will review the results looking for anything notable. Due to the number of automation tests, test suites of impacted features are identified and ran. If nothing concerning is found then the build is continued to production.
In the 25.4 release, our testing uncovered no concerns.
25.2 report
The aim of this document is to provide data on agreed performance metrics of the Privilege Management for Windows desktop client compared to the previous release.
The content of this document should be used to provide general guidance only. The are many different factors in a live environment which could show different results such as hardware configuration, Windows configuration and background activities, 3rd party products, and the nature of the EPM policy being used.
Performance benchmarking
Test Scenario
Tests are performed on dedicated VMs hosted in our datacenter. Each VM is configured with:
- Windows 10 22H2
- 4 Core 3.3GHz CPU
- 4GB Ram
Testing was performed using the GA release of 25.2
Test Name
Low Flexibility Quick Start policy with a single matching rule.
Test Method
This test involves a modified Low Flexibility Quick Start policy where a single matching rule is added which auto elevates an application based on its name. Auditing is also turned on for the application. The application is trivial command line app and is executed once per second for 30 minutes. Performance counters and EPM-W activity logging are collected and recorded by the test.
The Quick Start policy is commonly used as a base for all of our customers and it can be applied using our Policy Editor Import Template function. It was chosen as it's our most common use case. The application being elevated is a dummy application exe, which we’ve created specifically for this testing and it terminates quickly and doesn't have a UI, making it ideal for the testing scenario.
Results
Listed below are the results from the runs of the tests on 25.2 and our previous release, 24.8. Due to the nature of our product, we are very sensitive to the OS and general computer activity, so some fluctuation is to be expected.
Rule matching latency
Shows the time taken for the rule to match. Some small fluctuations were observed relative to the previous release, but this change in performance should not affect customers in a significant way as it is caused by small variations in the tests that we perform.
| Series | Mean | Min | Max |
|---|---|---|---|
| 24.8 Process Matching Rule Latency (ms) | 5.71 | 1.29 | 17.86 |
| 25.2 Process Matching Rule Latency (ms) | 5.68 | 1.28 | 20.38 |
% Processor Time
Percentage of processor time used. The mean percentage remains within <1% of the previous release, suggesting no significant change in processor usage that would impact customer experience.
| Series | Mean | Min | Max |
|---|---|---|---|
| 24.8 % Processor Time | 11.55 | 7.24 | 18.64 |
| 25.2 % Processor Time | 11.49 | 7.49 | 14.54 |
Thread Count (Defendpoint)
Number of threads used by Defendpoint. The mean has fluctuated but not outside our normal error margins for the test, while the minimum and maximum values remained unchanged. This indicates consistent threading behavior with a negligible increase in average usage that is unlikely to impact customer experience.
| Series | Mean | Min | Max |
|---|---|---|---|
| 24.8 Thread Count (DP) | 35.67 | 35.00 | 40.00 |
| 25.2 Thread Count (DP) | 35.51 | 35.00 | 40.00 |
Memory testing
For each release, we run through a series of automation tests (covering Application control, token modification, DLL control and Event auditing) using a build with memory leak analysis enabled to ensure there are no memory leaks. We use Visual Leak Detector (VLD) version 2.51 which when enabled at compile time replaces various memory allocation and deallocation functions to record memory usage. On stopping a service with this functionality an output file is saved to disk, listing all leaks VLD has detected. We use these builds with automation so that an output file is generated for each test scenario within a suite.
The output files are then examined by a developer who will review the results looking for anything notable. Due to the number of automation tests, test suites of impacted features are identified and ran. If nothing concerning is found then the build is continued to production.
In the 25.2 release, our testing uncovered no concerns.
24.8 report
The aim of this document is to provide data on agreed performance metrics of the Endpoint Privilege Management for Windows (EPM-W) desktop client compared to the previous release.
The content of this document should be used to provide general guidance only. The are many different factors in a live environment which could show different results such as hardware configuration, Windows configuration and background activities, 3rd party products, and the nature of the EPM policy being used.
Performance benchmarking
Test Scenario
Tests are performed on dedicated VMs hosted in our datacenter. Each VM is configured with:
- Windows 10 22H2
- 4 Core 3.3GHz CPU
- 4GB Ram
Testing was performed using the GA release of 24.8
Test Name
Low Flexibility Quick Start policy with a single matching rule.
Test Method
This test involves a modified Low Flexibility Quick Start policy where a single matching rule is added which auto elevates an application based on its name. Auditing is also turned on for the application. The application is trivial command line app and is executed once per second for 30 minutes. Performance counters and EPM-W activity logging are collected and recorded by the test.
The Quick Start policy is commonly used as a base for all of our customers and it can be applied using our Policy Editor Import Template function. It was chosen as it's our most common use case. The application being elevated is a dummy application exe, which we’ve created specifically for this testing and it terminates quickly and doesn't have a UI, making it ideal for the testing scenario.
Results
Listed below are the results from the runs of the tests on 24.8 and our previous release, 24.7. Due to the nature of our product, we are very sensitive to the OS and general computer activity, so some fluctuation is to be expected.
Rule matching latency
Shows the time taken for the rule to match. A small increase in mean and max latency was observed, but this change in performance should not affect customers in a significant way as it is caused by small variations in the tests that we perform.
| Series | Mean | Min | Max |
|---|---|---|---|
| 24.8 Process Matching Rule Latency (ms) | 5.71 | 1.29 | 17.86 |
| 24.7 Process Matching Rule Latency (ms) | 5.64 | 1.25 | 20.64 |
% Processor Time
Percentage of processor time used. In 24.8, the maximum value increased slightly compared to 24.7, while the minimum also rose, indicating a narrower range of variation. The mean percentage remains within <1% of the previous release, suggesting no significant change in processor usage that would impact customer experience.
| Series | Mean | Min | Max |
|---|---|---|---|
| 24.8 % Processor Time | 11.55 | 7.24 | 18.64 |
| 24.7 % Processor Time | 11.74 | 6.91 | 14.47 |
Thread Count (Defendpoint)
Number of threads used by Defendpoint. In 24.8, the mean thread count increased slightly compared to 24.7, while the minimum and maximum values remained unchanged. This indicates consistent threading behavior with a negligible increase in average usage that is unlikely to impact customer experience.
| Series | Mean | Min | Max |
|---|---|---|---|
| 24.8 Thread Count (DP) | 35.67 | 35.00 | 40.00 |
| 24.7 Thread Count (DP) | 35.58 | 35.00 | 40.00 |
Memory testing
For each release, we run through a series of automation tests (covering Application control, token modification, DLL control and Event auditing) using a build with memory leak analysis enabled to ensure there are no memory leaks. We use Visual Leak Detector (VLD) version 2.51 which when enabled at compile time replaces various memory allocation and deallocation functions to record memory usage. On stopping a service with this functionality an output file is saved to disk, listing all leaks VLD has detected. We use these builds with automation so that an output file is generated for each test scenario within a suite.
The output files are then examined by a developer who will review the results looking for anything notable. Due to the number of automation tests, test suites of impacted features are identified and ran. If nothing concerning is found then the build is continued to production.
In the 24.8 release, our testing uncovered no concerns.
24.7 report
The aim of this document is to provide data on agreed performance metrics of the EPM-W desktop client compared to the previous release.
The content of this document should be used to provide general guidance only. There are many different factors in a live environment which could show different results such as hardware configuration, Windows configuration and background activities, 3rd party products, and the nature of the EPM policy being used.
Performance benchmarking
Test Scenario
Tests are performed on dedicated VMs hosted in our data center. Each VM is configured with:
- Windows 10 22H2
- 4 Core 3.3GHz CPU
- 4GB Ram
Testing was performed using the GA release of 24.7.
Test Name
Low Flexibility Quick Start policy with a single matching rule.
Test Method
This test involves a modified Low Flexibility QuickStart policy where a single matching rule is added which auto elevates an application based on its name. Auditing is also turned on for the application. The application is trivial command line app and is executed once per second for 30 minutes. Performance counters and EPM-W activity logging are collected and recorded by the test.
The QuickStart policy is commonly used as a base for all of our customers and it can be applied using our Policy Editor Import Template function. It was chosen as it's our most common use case. The application being elevated is a dummy application .exe, which we’ve created specifically for this testing and it terminates quickly and doesn't have a UI, making it ideal for the testing scenario.
Results
Listed below are the results from the runs of the tests on 24.7 and our previous release, 24.5. Due to the nature of our product, we are very sensitive to the OS and general computer activity, so some fluctuation is to be expected.
This report uses a different test methodology to previous reports, so the results aren’t comparable. However, the previous release was re-run using the new methodology to allow us to compare results in this report.
Rule matching latency
Shows the time taken for the rule to match. A small increase in mean and max latency was observed, but this change in performance should not affect customers in a significant way as it is caused by small variations in the tests that we perform.
| Series | Mean | Min | Max |
|---|---|---|---|
| 24.7 Process Matching Rule Latency (ms) | 5.64 | 1.25 | 20.64 |
| 24.5 Process Matching Rule Latency (ms) | 5.38 | 4.23 | 17.74 |
% Processor Time
Percentage of processor time used. In 24.5, we observed a single large spike which contributed to a higher max percentage value, this is not present in 24.7, resulting in a lower max. The minimum is lower and the mean was within <1% so it’s unlikely that there would be any meaningful differences for a customer.
| Series | Mean | Min | Max |
|---|---|---|---|
| 24.7 % Processor Time | 11.74 | 6.91 | 14.47 |
| 24.5 % Processor Time | 11.85 | 8.29 | 19.46 |
Thread Count (Defendpoint)
Number of threads being used by Defendpoint. 24.7 is using one more thread on average than 24.5. This new thread was short lived which results in the mean being very similar between 24.5 and 24.7.
| Series | Mean | Min | Max |
|---|---|---|---|
| 24.7 Thread Count (DP) | 35.58 | 35.00 | 40.00 |
| 24.5 Thread Count (DP) | 35.48 | 34.00 | 39.00 |
Memory testing
For each release, we run through a series of automation tests (covering Application control, token modification, DLL control and Event auditing) using a build with memory leak analysis enabled to ensure there are no memory leaks. We use Visual Leak Detector (VLD) version 2.51 which when enabled at compile time replaces various memory allocation and deallocation functions to record memory usage. On stopping a service with this functionality an output file is saved to disk, listing all leaks VLD has detected. We use these builds with automation so that an output file is generated for each test scenario within a suite.
The output files are then examined by a developer who will review the results looking for anything notable. Due to the number of automation tests, test suites of impacted features are identified and ran. If nothing concerning is found then the build is continued to production.
In the 24.7 release, our testing uncovered no concerns.
24.5 report
The aim of this document is to provide data on agreed performance metrics of the EPM-W desktop client compared to the previous release.
The content of this document should be used to provide general guidance only. There are many different factors in a live environment which could show different results such as hardware configuration, Windows configuration and background activities, 3rd party products, and the nature of the EPM policy being used.
Performance benchmarking
Test Scenario
Tests are performed on dedicated VMs hosted in our data center. Each VM is configured with:
- Windows 10 22H2
- 4 Core 3.3GHz CPU
- 4GB RAM
Testing was performed using the GA release of 24.5
Test Name
Low Flexibility Quick Start policy with a single matching rule.
Test Method
This test involves a modified Low Flexibility Quick Start policy where a single matching rule is added which auto elevates an application based on its name. Auditing is also turned on for the application. The application is trivial command line app and is executed once per second for 30 minutes. Performance counters and EPM-W activity logging are collected and recorded by the test.
The Quick Start policy is commonly used as a base for all of our customers and it can be applied using our Policy Editor Import Template function. It was chosen as it's our most common use case. The application being elevated is a dummy application exe, which we’ve created specifically for this testing and it terminates quickly and doesn't have a UI, making it ideal for the testing scenario.
Results
Listed below are the results from the runs of the tests on 24.5 and our previous release, 24.3. Due to the nature of our product, we are very sensitive to the OS and general computer activity, so some fluctuation is to be expected.
This report uses a different test methodology to previous reports, so the results aren’t comparable. However the previous release was re-run using the new methodology to allow us to compare results in this report.
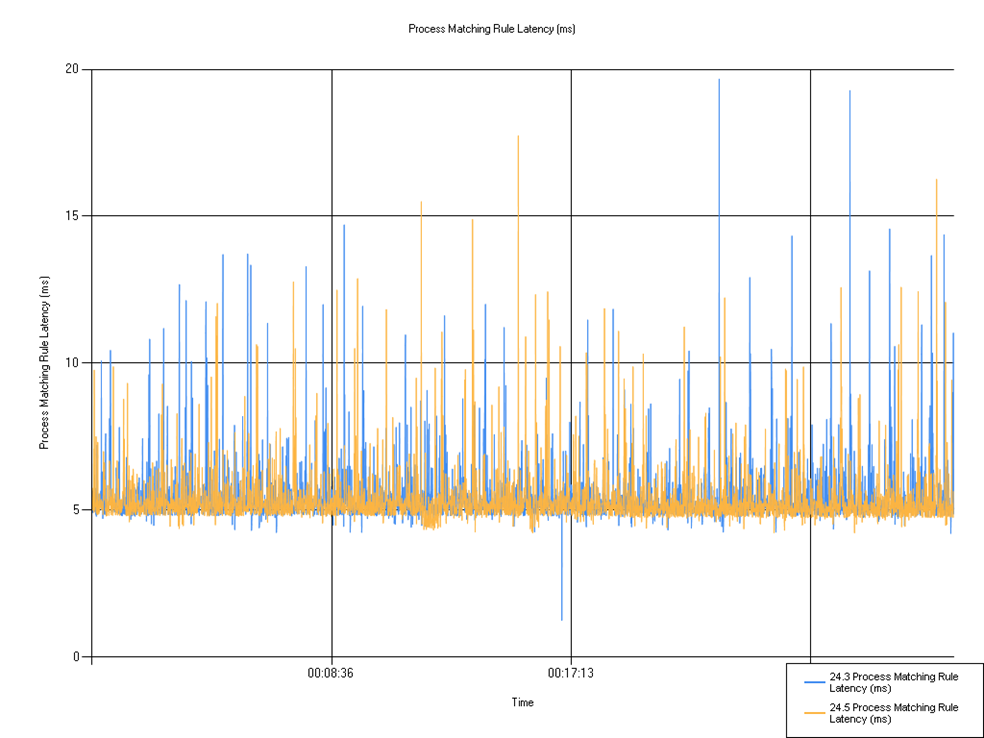
Rule matching latency
Shows the time taken for the rule to match. We can observe a small decrease in mean and max latency from 24.3 to 24.5, and a seemingly large increase in minimum latency, though on further inspection you can see that in the 24.3 run, there was only a single spike at that greatly reduced latency number, otherwise the graphs look very similar. These minor changes are unlikely to make any difference to user experiences.
| Series | Mean | Min | Max |
|---|---|---|---|
| 24.3 Process Matching Rule Latency (ms) | 5.46 | 1.25 | 19.67 |
| 24.5 Process Matching Rule Latency (ms) | 5.38 | 4.23 | 17.74 |
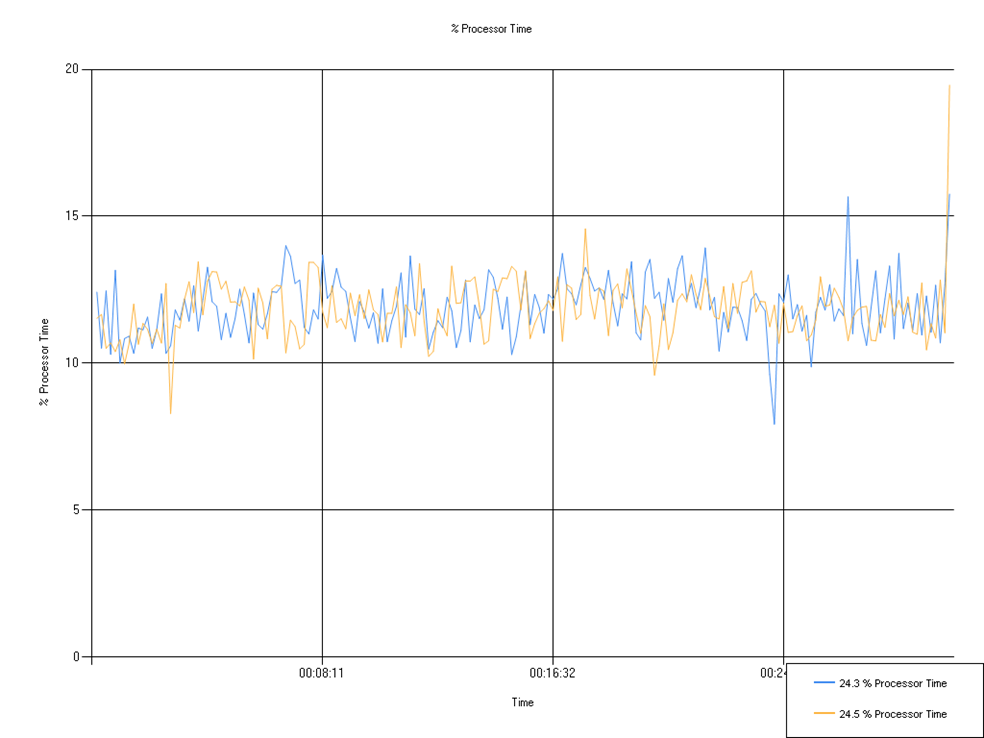
% Processor Time
Percentage of processor time used. We observed a single large spike which contributed to a higher max percentage value, but the minimum and mean were within 0.4%. It’s unlikely that there would be any meaningful differences for a customer.
| Series | Mean | Min | Max |
|---|---|---|---|
| 24.3 % Processor Time | 11.92 | 7.93 | 15.76 |
| 24.5 % Processor Time | 11.85 | 8.29 | 19.46 |
Thread Count (Defendpoint)
Number of threads being used by Defendpoint. 24.5 is using one more thread on average than 24.3.

| Series | Mean | Min | Max |
|---|---|---|---|
| 24.3 Thread Count (DP) | 34.59 | 33.00 | 38.00 |
| 24.5 Thread Count (DP) | 35.48 | 34.00 | 39.00 |
Memory testing
For each release, we run through a series of automation tests (covering Application control, token modification, DLL control and Event auditing) using a build with memory leak analysis enabled to ensure there are no memory leaks. We use Visual Leak Detector (VLD) version 2.51 which when enabled at compile time replaces various memory allocation and deallocation functions to record memory usage. On stopping a service with this functionality an output file is saved to disk, listing all leaks VLD has detected. We use these builds with automation so that an output file is generated for each test scenario within a suite.
The output files are then examined by a developer who will review the results looking for anything notable. Due to the number of automation tests, test suites of impacted features are identified and ran. If nothing concerning is found then the build is continued to production.
In the 24.5 release, our testing uncovered no concerns.
Updated 11 days ago