User analytics | EPM-WM Cloud
Gain visibility into when users log on to managed endpoints, what privileges they use (standard or administrator), and any events associated to those users.
The Users page
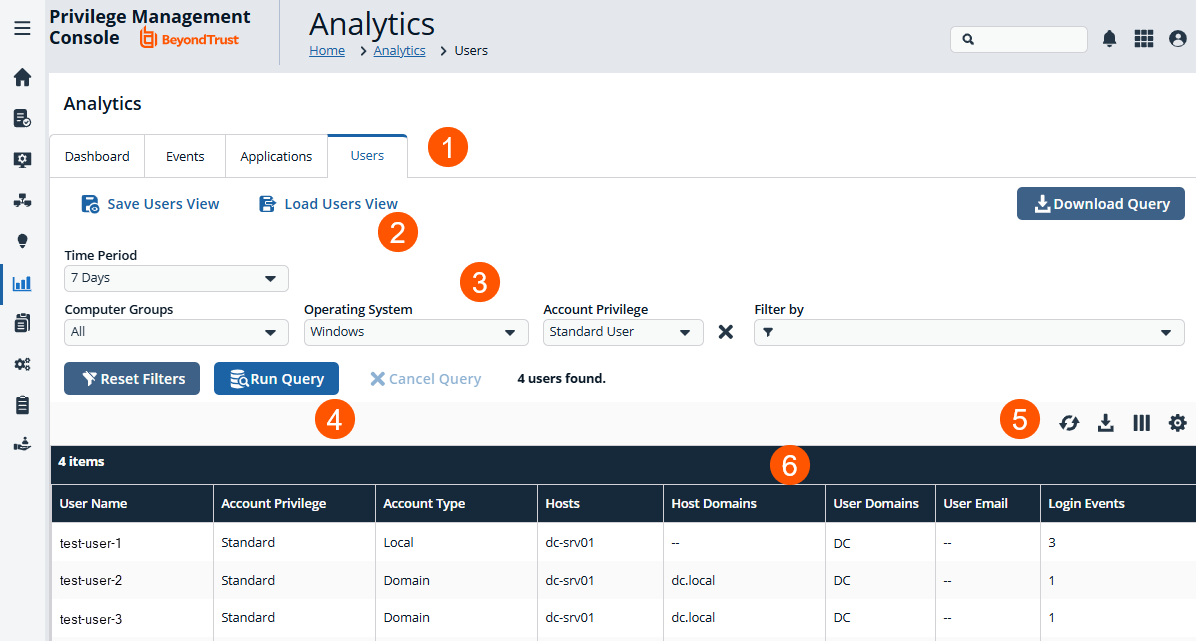
- Analytics tabs: Access the Dashboard, Events, Applications, and Users pages.
- Save View and Load View: Save your filter preferences and load the view later for quick access to your most frequently-used preferences.
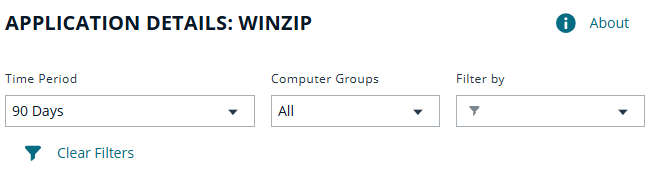
- Filters: Select a filter to refine your results. Click Clear Filters to remove all filters from your results.
Available filters
- Account privilege
- Account type
- Host domain
- Home name
- User domain
- User name
- User Email
- Save View and Load View: Save your filter preferences and load the view later for quick access to your most frequently-used preferences.
-
List options: Click
 to refresh the list,
 ![Download icon in [%=Products.PMAb%] SaaS.](https://files.readme.io/3cc3e35e3ac6a72ce0bc3747df69a1c29f39b1cb9e45570604098be3bff4b1eb-download-icon.png) to download the list to a .csv file,
to download the list to a .csv file,  to select which columns to display on the page, and
 ![Settings icon in [%=Products.PMAb%] SaaS.](https://files.readme.io/1da1862e7b8565ca38a623a35c566249525c7215d7a8fce5c316680cbc54d44d-icon-grid.png) to configure your page display.
to configure your page display. - Columns: At-a-glance details for each user.
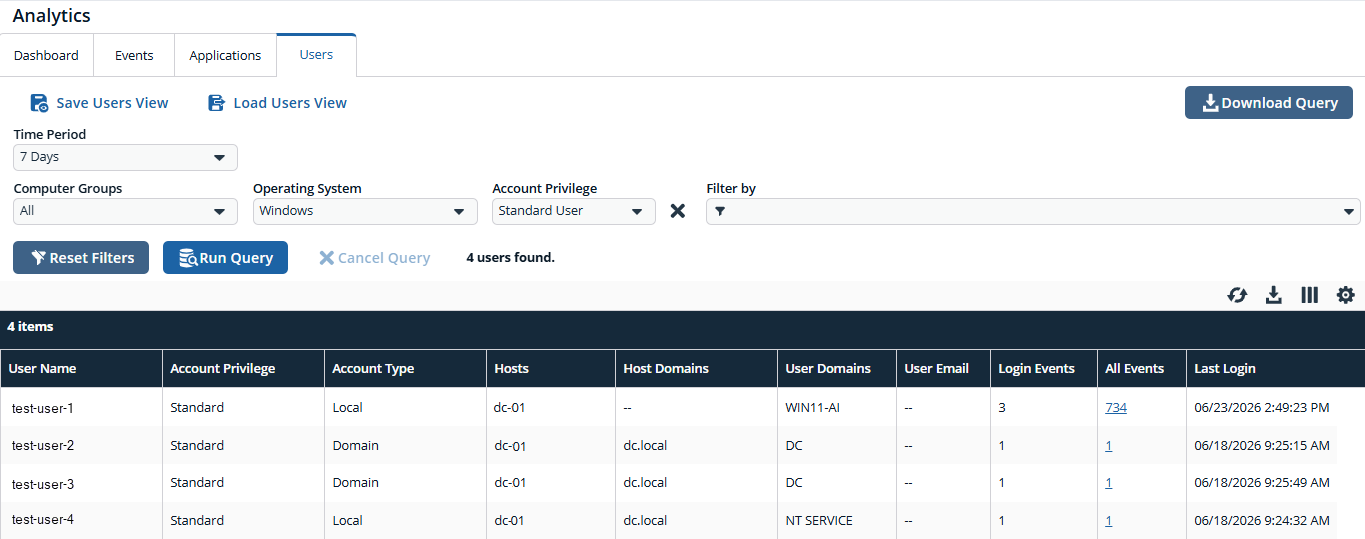
Available columns
- User Name
- Account Privilege
- Account Type
- Hosts
- Host Domains
- User Domains
- User Domains
- Login Events
- All Events
- Last Login
- User Identifier
- User Email
Download query
Download a query to get the data set right away without running a query or waiting for the page to load. This helps you get the information you need faster.
-
From the left menu, click
 .
.
The Analytics page displays. -
Click Users.
The Users page displays. -
Click Download Query.
The Prepare Download dialog box displays.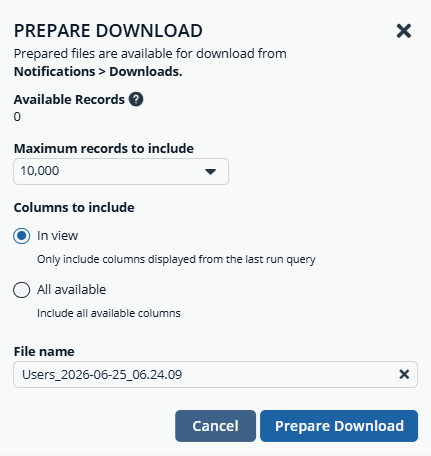
-
Set maximum records to include and a file name. The results set is saved to a CSV file.
-
Select Prepare Download.
Run a query
You can run searches on demand using the Run Query feature.
-
From the left menu, click
 .
.
The Analytics page displays. -
Click Users.
The Users page displays. -
Select and apply filters then click Run Query to get and display the results.
Click Cancel Query at any time to stop processing the request.
- The Loading applications message displays while waiting for the data to load.
- To ensure your data loads correctly when you select Load Users View, always select Run Query before saving the view.
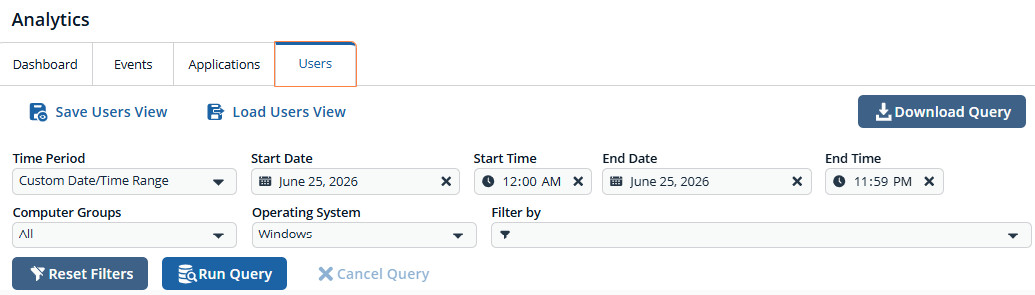
Set a custom date range filter
You can find users for any date range you choose. It’s an easy way to focus on the results you want to see.
-
Select Custom Date Range from the Time Period filter list and pick your dates.
The date range must be within the last 90 days.
View an application's user activity
On the User Activity tab, you can:
- See how many users are running an application
- The reason provided by users, if one is required
- Actions by users (allowed, blocked, etc)
To access user activity on an application:
- Go to the Applications grid.
- Click the link for the application you are interested in.
- Click the User Activity tab to see information about the users accessing the application. See the following sections to learn more about the collected data.
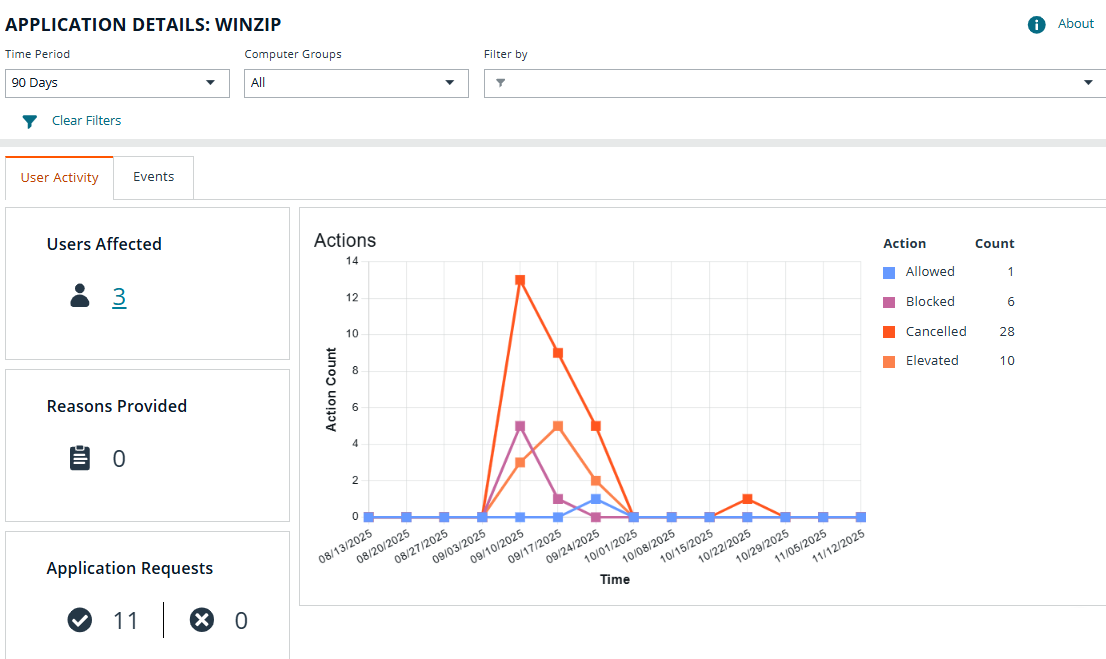
Use the filters to dynamically update the data.
- Users Affected: Shows the number of users running the application. Drill down to see more details about the users.
- Reasons Provided: Click the link to view a breakdown of the reasons provided by users authenticating to use the application.
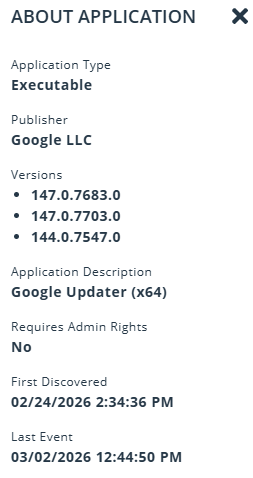
Application details
Click the About link on the Application Details page for deeper context of the application you are viewing.
Access information such as the application type, versions, the publisher, whether admin rights are required, when the event was first discovered, and when the last event occurred.
Graph data
The graph provides valuable insights with the following features:
-
Default filters: The graph initially displays with two default filters, Time Period and Computer Groups. You can change these filters and add filters to adjust the scope of the displayed data, based on the information you want to see.
-
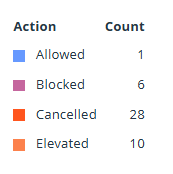
Interactive Actions legend: Use the interactive Actions legend to dynamically update the graph. Click to display or hide any of the available event actions to customize the information presented.
-
End user metrics: Gain valuable end-user metrics, such as the frequency of event actions (Blocked, Elevated, Allowed, and Canceled), for a particular application over a defined time period.
Export to CSV
- Sign into your EPM instance.
The Home page displays. - From the left menu, click Analytics.
The Analytics page displays. - Select the Users tab.
- Clickto export all analytics data results in the currently filtered result set. The CSV download can include up to 5 million records with detailed information on account privileges.
- When saving an export file for users:
- Select the maximum number of records to download.
- Select the columns to include. Select In View to include only the columns currently selected in your view. Select All Available to include all columns even those not currently displayed.
- Enter a file name.
- Click Prepare Download.
- Click the Notifications icon when the file is ready to download.
Save and load views
EPM users with Analyze Group permissions can create and save a set of filters and columns so that the same set of filters does not have to be selected every time Analytics is accessed. Saving viewing preferences provides an easy way to return to views of data used frequently to monitor Endpoint Privilege Management activity in the estate.
You can load and save data sets from the Events page, Applications page, and Users page.
Access views on any device regardless of the device the views were created on.
- After selecting filters, select Save View to retain those preferences for viewing later. Preferences are saved locally.
- If a view name already exists, select Overwrite existing view, and then select the view you want to replace.
- The next time you access Analytics, your view settings are preserved. Click Load View to select and load a view.
- On the Load Event View pane, you can delete and refresh views.
Updated 4 days ago