
Events | AI Agent Security
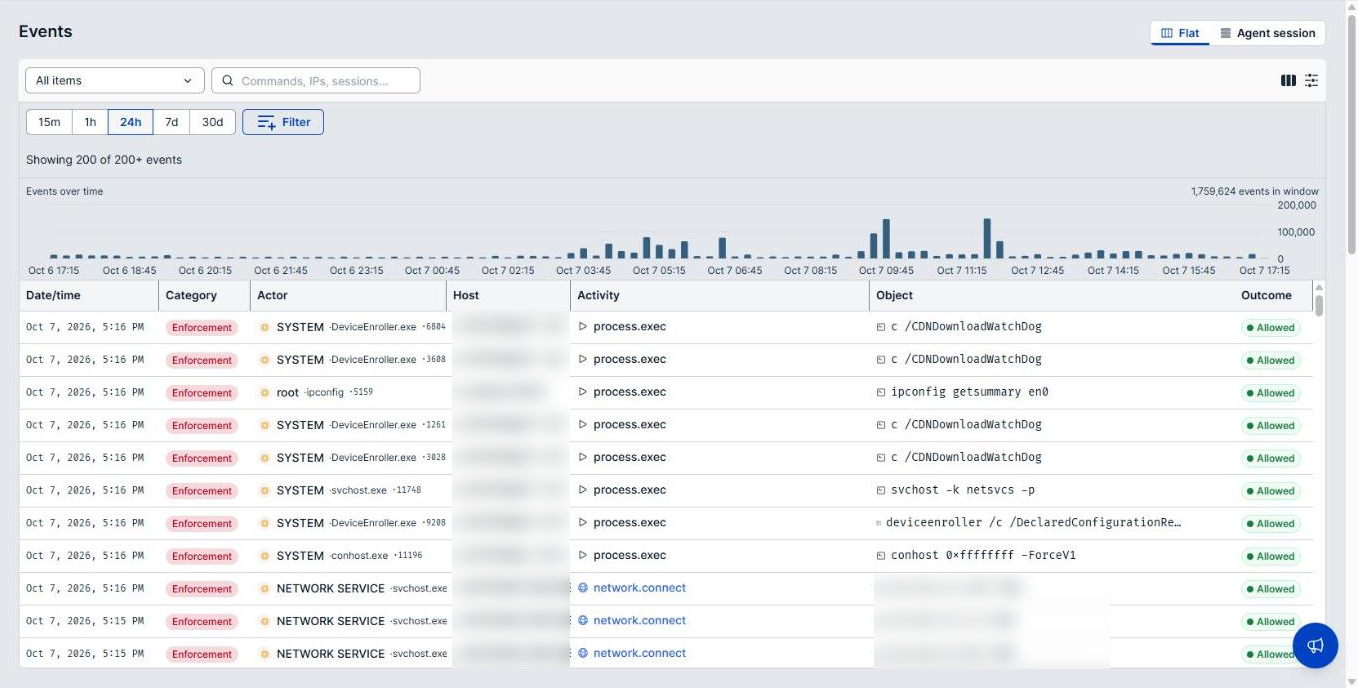
The Events page is the raw record of what agents did across your fleet (for example every file opened, command run, and connection made). A single endpoint can generate tens of thousands of events a day, so this page is built for narrowing rather than reading. Set a time range and filters first, then read what is left.
Scope of this guide
This guide explains the Events page: the two views, the time range and display controls, the event list and its columns, and how to search and filter. It does not cover interpreting individual event types.
Prerequisites
- You have administrator access to the tenant.
- The AI Agent Security agent is reporting from at least one endpoint.
Open the Events page
Go to Intelligence > Events.
The count above the list shows how many events are loaded out of how many match, such as Showing 200 of 200+ events.
A count ending in + is a cap, not a total. 200+ means at least 200 and possibly far more, so use it to judge whether your filters are narrow enough, not to report volume. The Events over time graph below the toolbar shows the true volume in the time range, such as 1,761,943 events in window.
Choose a view
Two buttons at the top right change how events are arranged.
| View | Description |
|---|---|
| Flat | Every event in one chronological list. |
| Agent session | Events grouped by the agent session they belong to. |
Flat is selected when the page opens. Use it when you know what you are looking for. Use Agent session when you want to see what a single agent did in sequence, since related events are otherwise separated by everything else the fleet did in the same second.
Set the time range
Select 15m, 1h, 24h, 7d, or 30d to cover the last 15 minutes, hour, 24 hours, 7 days, or 30 days. 24h is selected by default.
The time range is the most effective control on this page. Narrowing from 24 hours to 15 minutes cuts the volume far more than any single filter.
Display controls
| Control | Description |
|---|---|
| Columns | Choose which columns appear in the list. Drag a column edge to resize it; widths are remembered. |
| View selector | Save the current arrangement of filters and columns, or apply a view you saved. All items is the unfiltered view. |
| Display options | A menu holding three switches: Show graph (the Events over time graph), Show hidden (heartbeat and driver status events, off by default), and Auto-refresh (updates the list every 30 seconds). |
Once you have a combination of filters, columns, and time range that answers a question you ask often, save it as a view rather than rebuilding it. Views belong to you, not the tenant.
Turn off Auto-refresh before you work through a set of results. With it on, the list moves as new events arrive, and rows shift while you are reading them.
Show hidden matters when events seem to be missing. Heartbeat and driver status events are excluded by default, so an event you expect to see may be present but suppressed.
Column reference
| Column | Description |
|---|---|
| Date/time | When the event happened. |
| Category | The kind of event, such as Enforcement. |
| Actor | What performed the action, usually the full path to a process. |
| Host | The endpoint the event came from. |
| Activity | What was attempted, such as file.open. Select the activity to open the event. |
| Object | What the activity applied to. |
| Outcome | What happened: Blocked, Audited, Allowed, or Observed. |
Use the time range, search, and filters to narrow the list rather than sorting it.
The Columns control also offers Risk and Actions columns, which are hidden by default.
File paths in Object appear in device form, such as \Device\HarddiskVolume3\Windows\..., rather than as drive letters. HarddiskVolume3 is the volume the path sits on, not a folder. Expect to translate when comparing these paths against ones from elsewhere.
Search for an event
- Select the Commands, IPs, sessions… box.
- Enter your search text.
The list narrows as you type. Clear the search box to show all events again.
Filter the list
- Select Filter.
- Choose the field you want to filter on, such as Outcome, Actor, Category, Event type, Host, Policy, or Session.
- Choose the values you want to keep.
Each filter appears as a chip above the list, and the event count updates to match. Select Clear all to remove every filter at once.
Example: Filter on Outcome for Blocked to see only the actions a policy stopped.
When you arrive from another page, such as an endpoint or a policy, a Filtered: banner above the list shows what the list is narrowed to. Remove a chip in the banner to widen the list.
Verify the results
Confirm the time range, the filters, and the state of Show hidden before concluding an event did not occur. Absence on this page is a claim about your current filters, not about your fleet.
Check whether the count still ends in +. While it does, you are looking at a capped sample and cannot tell how much you have not seen.
Next steps
- Switch to Agent session to see a suspicious event in the context of everything else that agent did.
- Save the filters you use regularly as a view.
- To review activity on one machine rather than the whole fleet, open that endpoint and use its Events tab.
Updated about 2 hours ago
