
AI session details | AI Agent Security
The AI Sessions list tells you a session produced findings. The details panel shows you why: which policies denied or audited an action, where the session reached on the network, which MCP servers it used, and which files it touched. The full session page adds the transcript and every finding, so you can trace a finding back to the prompt that led to it.
Scope of this guide
This guide explains the AI session details panel and the full session page: their sections, tabs, and actions. It does not cover writing policy rules.
Prerequisites
- You have administrator access to the tenant.
- At least one session appears on the AI Sessions page.
Open the details panel
- Go to Intelligence > AI Sessions.
- Select the session you want to review.
The header names the developer and repository, then the tool, the number of events, and when the session started, such as Claude Code · 9 Events · Started 1h ago, with the session's Outcome beside it. To close the panel, select the X in the top right corner.
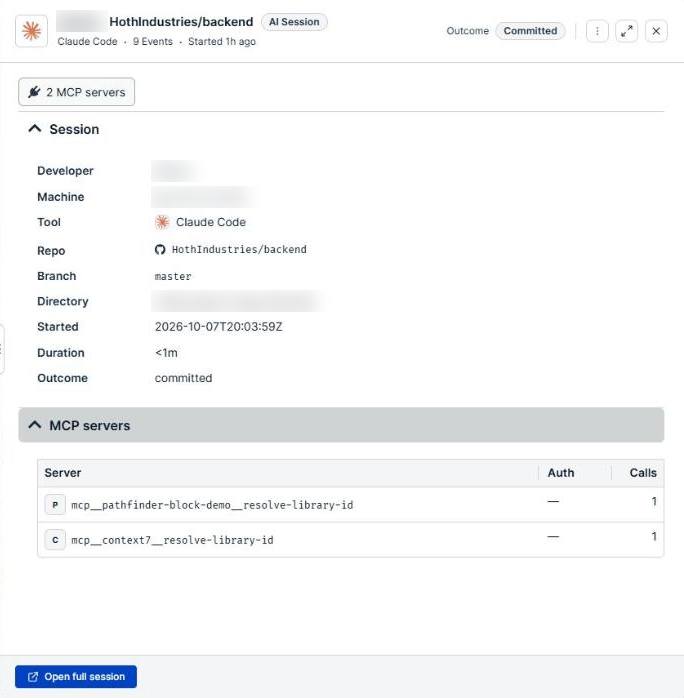
The panel summarizes the session from its recorded detail, and it shows a section only when it has data for it. A session can show Session and MCP servers alone even though the list reports findings and egress for it. Select Open full session for the complete record.
Session
Select the caret beside a heading to collapse or expand its section.
| Field | Description |
|---|---|
| Developer | The user who ran the session. |
| Machine | The endpoint the session ran on. |
| Tool | The AI coding tool used, shown with its icon. |
| Repo | The repository the session worked in. A dash (—) means none was identified. |
| Branch | The branch the session worked on. A dash (—) means none was identified. |
| Directory | The working directory for the session. |
| Started | When the session began, in UTC. |
| Duration | How long the session has run, or ran. |
| Outcome | How the session ended, such as committed, or that it is still in progress. |
Started is shown in UTC here, while the AI Sessions list shows your local time. The same session can appear to start at two different times across the two views. Compare the Duration and the developer instead when you are matching a row to a panel.
While the session is in progress, the counts in this panel are still moving. Note the values you acted on, because they will not match when you reopen the panel later.
Findings
The Findings section lists the actions a governing policy denied or audited during the session.
| Column | Description |
|---|---|
| Finding | What the policy caught. |
| Severity | How serious the finding is, such as High. |
This section is the answer to "why did this session show up." A session with one High finding is flagged on the strength of that single finding.
Network egress
The Network egress section lists where the session connected.
| Column | Description |
|---|---|
| Destination | The host the session reached. |
| Via | The process that made the connection. |
| Calls | How many times the session reached that destination. |
| Decision | Whether the connection was allowed or blocked. |
MCP servers
The MCP servers section lists the MCP servers the session used.
| Column | Description |
|---|---|
| Server | The MCP server. |
| Auth | Whether the server required authentication. |
| Calls | How many tool calls the session made to it. |
Files changed
The Files changed section lists the files the session touched.
| Column | Description |
|---|---|
| File | The file name. Open the full session to see complete paths. |
| Change | What the session did with the file. Viewed means the file was read, not modified. |
| Diff | Lines added and removed, such as +12 -3. A dash (—) means no diff was recorded. |
This list includes files the session only read. Check the Change column before you treat an entry as a modification, and read the file names themselves, because what a session read can matter more than what it wrote.
Full session page
Select Open full session at the bottom of the panel to open the session on its own page. The page covers the whole session, not only its recent events.
Tabs
| Tab | Description |
|---|---|
| Summary | Counts, the timeline, network and MCP activity, files, and process and file activity. |
| Transcript | The conversation between the developer and the tool, with every tool call. |
| Findings | Every finding in the session. The count appears in the tab label. |
Summary tab
A row of counts sits at the top.
| Count | Description |
|---|---|
| Findings | The number of distinct governing policies that denied or audited an action in the session. |
| Reads | File read and search calls. |
| Edits | File writes that were not denied, with blocked write attempts counted separately below. |
| Commands | Shell commands, split into allowed and blocked. |
| Tool calls | Other tool calls. A trailing + means the count covers only part of a very long session. |
Cards sit below the counts.
| Card | Description |
|---|---|
| Timeline | The session broken into phases, where consecutive actions of the same kind and outcome form one phase. |
| Network egress | Outbound network activity. Reads No network activity in this session. when there was none. |
| MCP servers | MCP servers the session used. Reads No MCP servers used in this session. when there were none. |
| Files | The files the session touched, split into Changed and Viewed, each with a count. Select either to switch the list. |
| Process and file activity | Process and file events attributed to the session, grouped by event type and target. |
The Files card separates changed from viewed, and the gap between them is usually large: a session can view hundreds of files while changing none. Read Changed for what the session did, and Viewed for what it saw.
Transcript tab
The transcript shows the session as a conversation: the developer's prompts, the tool's replies, and each tool call it made. When the tool asked the developer a question, the question and the answer appear as an exchange. Tool calls that started other processes are nested under the call that started them.
Findings tab
Each row is one finding. Select a row to open its details, including the policy that fired and the action it caught. When the session has none, the tab reads No findings and No governing policy denied or audited an action in this session.
Some rows offer Create policy from this, which opens a Create policy dialog prefilled from the session. Select Open in builder to finish the policy in the policy builder.
More actions
The More actions menu at the top of the page offers Copy session ID, Copy link to session, and View raw events. View raw events opens the Events page filtered to this session.
Verify the results
Confirm the Machine and Started values match the session you meant to open, since one developer can run several sessions in a day from the same directory. For a session still in progress, expect the counts and the Findings tab label to grow while you watch.
Next steps
- Open the Findings tab on any session with a High finding and trace it back to the prompt in the Transcript tab.
- Review the file paths under Files changed and confirm the session had a reason to read each one.
- Select View raw events to see every event the session produced.
Updated about 2 hours ago
