Monitor events with the Operations Dashboard | AD Bridge
What is the AD Bridge Operations Dashboard?
The AD Bridge Operations Dashboard is a management plug-in for the BeyondTrust Management Console. The dashboard runs on a Windows administrative workstation connected to the AD Bridge Reporting Database and an Active Directory domain controller.
How is it useful?
The dashboard retrieves information from the AD Bridge database to display authentication transactions, authorization requests, network events, and other security events on Linux and Unix computers.
Monitoring events such as failed logon attempts and failed sudo attempts can help prevent unauthorized access to commands, applications, and sensitive resources.
Events
The list includes some of the events the dashboard can display. You can also create and monitor custom events.
- All Success Audit Events
- All System Log Error Events
- Console Logons (AD or Local)
- Domain Joins
- Domain Leaves
- Failed Console Logons (AD or Local)
- Failed Group Policy Updates
- Failed Kerberos Refresh
- Failed Password Change
- Failed Root Logons (Local)
- Failed SSH Logons (AD or Local)
- Failed Sudo
- AD Bridge Services Failures
- Network Offline Warning
- Root Account Logons (Local)
- SSH Logons (AD or Local)
- Sudo
Configure settings for the dashboard
By default, the dashboard is set to display selected metrics. As you become familiar with these metrics, you can customize settings so you can track critical activities occurring in your clients.
You can:
- change the list of metrics displayed
- configure alerting
- change the refresh rate for the display
- customize metrics
Add the dashboard to the console
By default, the Operations Dashboard node is displayed in the BeyondTrust Management Console. If it is not displayed, you can add the dashboard plug-in to the console.
- On a Windows administrative workstation, start the BeyondTrust Management Console.
- From the File menu, click Add/Remove Plug-in.
- Click Add.
- Click Operations Dashboard, click Add, and then click Close.
- Click OK.
Connect to a database using the BeyondTrust Management Console
To connect to a database or change your database connection:
- Log into the BeyondTrust Management Console.
- Right-click Operations Dashboard and then click Connect to.
- Click Change.
- Select the database type.
- From the Server\Instance list, select the instance, and then select the credentials.
- Click OK.
Change the refresh rate in the BeyondTrust Management Console
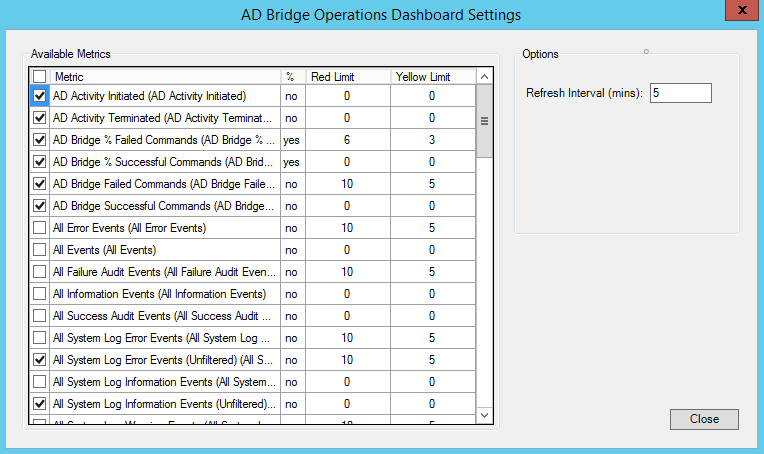
You can change the minutes that pass before the information on the dashboard is updated with the latest metrics. The default value is 5 minutes.
To change the refresh rate:
-
Log into the BeyondTrust Management Console.
-
Right-click Operations Dashboard and then click Metric settings.
-
In the Refresh Interval box, enter the minutes that pass before the information on the dashboard is updated with the latest metrics.
-
Click Close.
Change the metrics to display on the operations dashboard
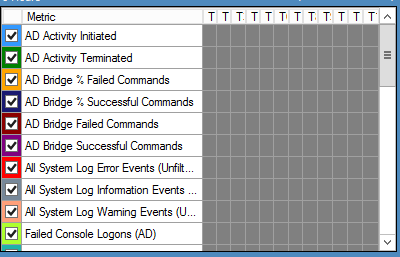
You can change the metrics that you want to display on the Operations Dashboard.
-
To change the metrics displayed, log into the BeyondTrust Management Console.
-
Right-click the Operations Dashboard node, and then click Metric settings.
-
Scroll through the list of metrics and check or clear the boxes depending on the metrics you want to display.
After you change the metrics, the database update program runs to ensure the data between the database and Active Directory is synchronized.
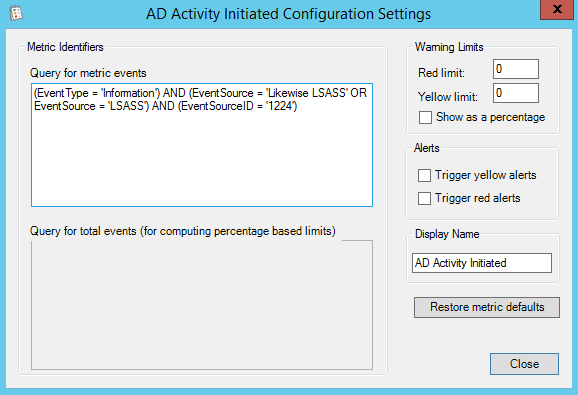
Change the properties for a metric
Configure the properties
You can configure properties for a metric, including:
- Warning limits
- For example, you might want to set a red flag limit on a metric. When the activity exceeds that value, a red flag is issued.
- Alerts
- If you configure the warning limits, you can set an alert that will be issued when the limit is reached.
- A query that adds the total number of events
Set properties for a metric
-
Log into the BeyondTrust Management Console.
-
Expand the Operations Dashboard node.
-
Right-click the Domains node, or Subnets node, and then select Metric settings.
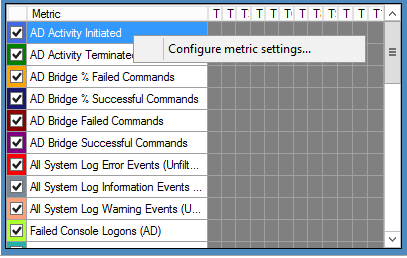
-
Right-click a metric, and select Configure metric settings.
-
Set the warning limits.
-
Depending on your requirements, check the boxes to turn on the alerts for the warning limits.
-
Click Close.
Analyze events on the dashboard
After you configure and customize the view on the dashboard, you can quickly view the results to determine if assets are out of compliance.
View the number of events
- Log into the BeyondTrust Management Console.
- Expand the Operations Dashboard node, and then expand the Domain node or Subnets node.
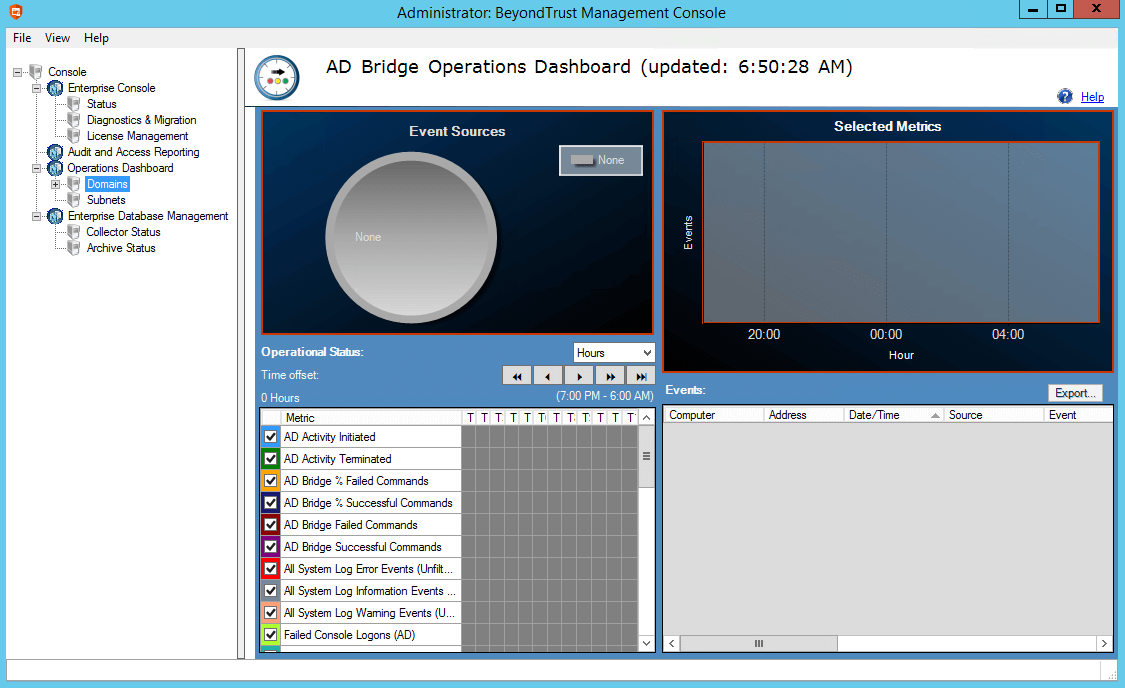
- Select a domain. The following example shows Event Sources and Selected Metrics.
-
Event Sources: Displays the number of events tracked and displays the domain name where the events occurred.
-
Selected Metrics: Displays the total number of events collected and the selected collection period. You can select the time frame from the Operational Status list to analyze trends over the time period.
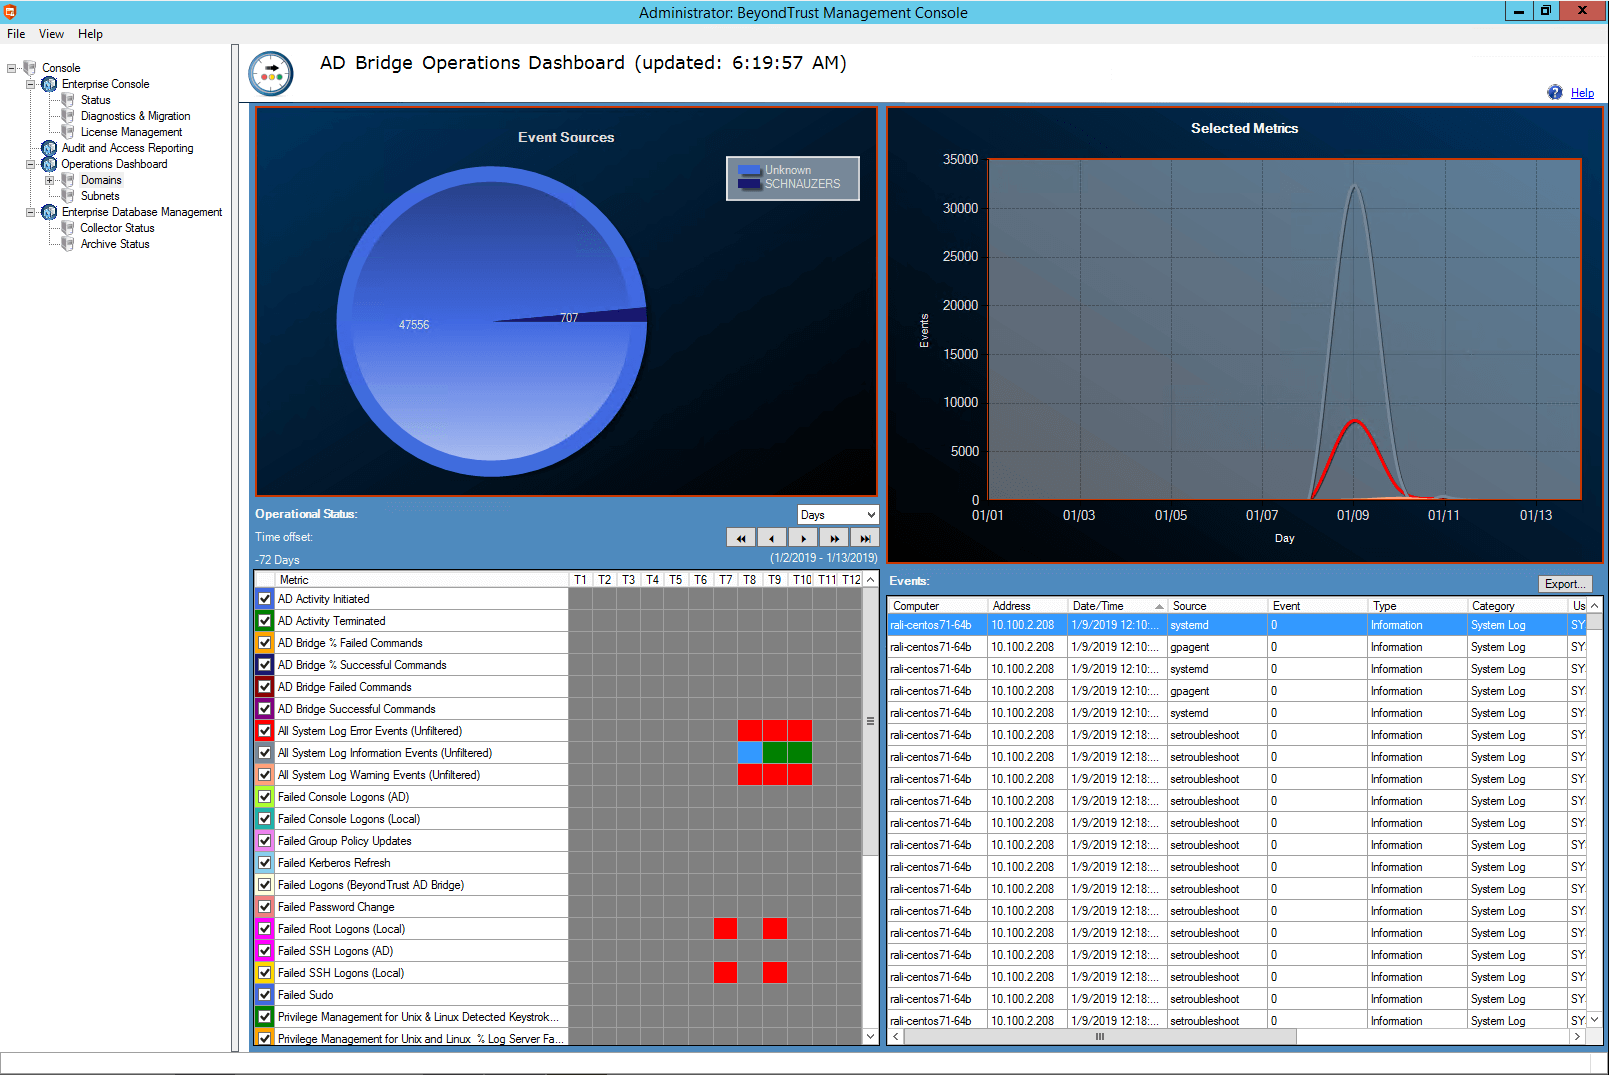
In the metrics pane, you can view the assets where the events occurred. For example, in the following, select a green rectangle (that represents a period in time), which will display the computers in the right pane where the activity occurred.
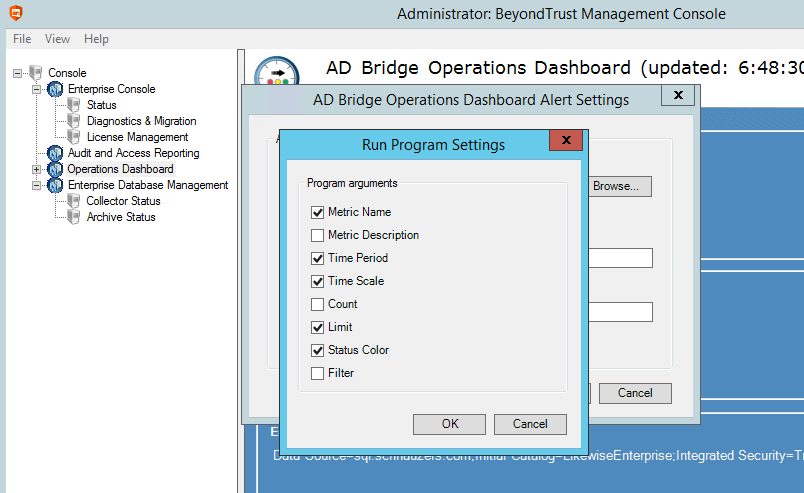
Set alert notifications in the BeyondTrust Management Console
You can track specific activities and receive email alerts when the activity occurs.
To track event activities and configure alerts:
-
Log into the BeyondTrust Management Console.
-
Right-click the Operations Dashboard, and then select Alert Settings.
-
On the Operations Dashboard Alert Settings dialog box, select the following:
- Run this program: Check the box, and then click Browse to navigate to the program that you want to run.
- Command Line Arguments Click to select the activities that you want to monitor. Click OK.
- Sent email message to: Check this box to send email alerts. Click the Email Settings button to configure the SMTP server and add the email account that will receive the alerts.
Archive events with the BTArchive
You can archive events in two ways: either with the Enterprise Database Management plug-in or with the command line.
The AD Bridge event-archiving utility BTArchive combines events older than one year into compressed archives and stores them in a separate database table. A separate archive is created for each month of old event data. After events are archived, they are deleted. The event-archiving utility is intended to be run according to a monthly schedule.
Archive events using the console
To archive events using the console:
- In the console tree, expand Enterprise Database Management.
- Right-click Archive Status, and then select Create archive.
- Follow the instructions in the wizard.
Archive events using the command line
To view the arguments of BTArchive, execute the following command at the shell prompt on a Windows computer running the AD Bridge collectors:
C:\Program Files\BeyondTrust\PBIS\Enterprise>btarchive --helpThe –p and –c options identify the database type and connection string of the central AD Bridge database.
The connection string is the same as the one used to configure the connection to the database. With SQL Server, for example, you enter a string like this:
Data Source=DBSERVERNAME;Initial Catalog=LikewiseEnterprise;Integrated Security=True
ExampleData Source=DBSERVERNAME;Initial Catalog=LikewiseEnterprise;Integrated Security=True
The -a and –t options control the archive time unit and the date threshold for archiving.
We suggest you use the default settings, which are -a monthly and -t 12. These defaults create monthly archives for data older than 12 months.
The –o option controls where the log output of BTArchive is written.
By default, the output is written to the console.
Updated 14 days ago