Identity Security Insights 26.06
🆕 New features
This release introduces an AI-powered explanation feature that translates any path or finding into plain-language descriptions on demand. Escalation paths that present elevated risk are now visually highlighted in the graph view. Additional updates improve the readability and usability of the Insights interface.
AI explanations for graphs, detections, and recommendations
AI Explanations generate plain-language descriptions for any path or finding in the interface. No additional configuration or data export is required. Select any path or finding to view an explanation on demand.
What you get with this feature
-
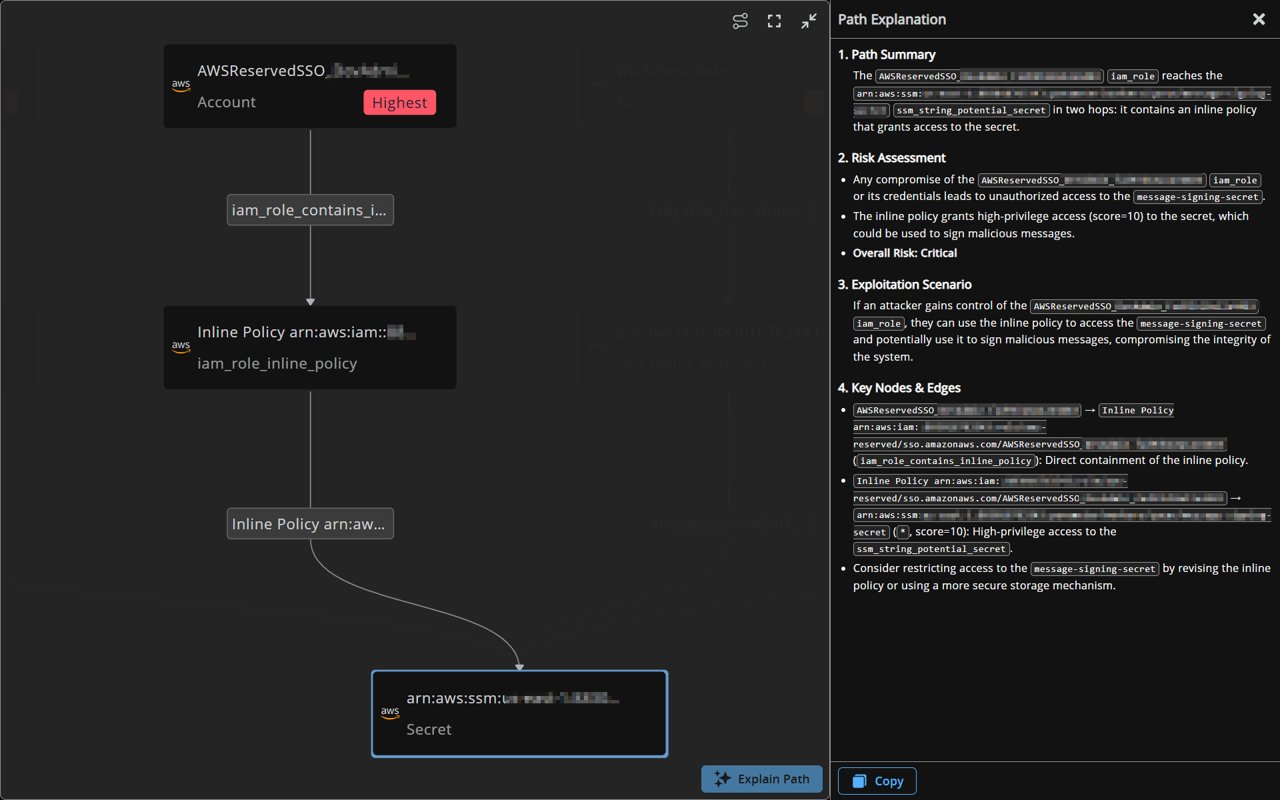
Explain any path to privilege, right on the graph: Open the graph in the side panel for your Secrets, AI Agents, Entitlements, or Accounts, select a node along the path – like the secret or account at the end of it – and click Explain Path.
A Path Explanation panel breaks down how the path actually chains together, the risk it represents, how an attacker could exploit it, and the key nodes and relationships driving it turning a web of dots and edges into a story you can act on. -
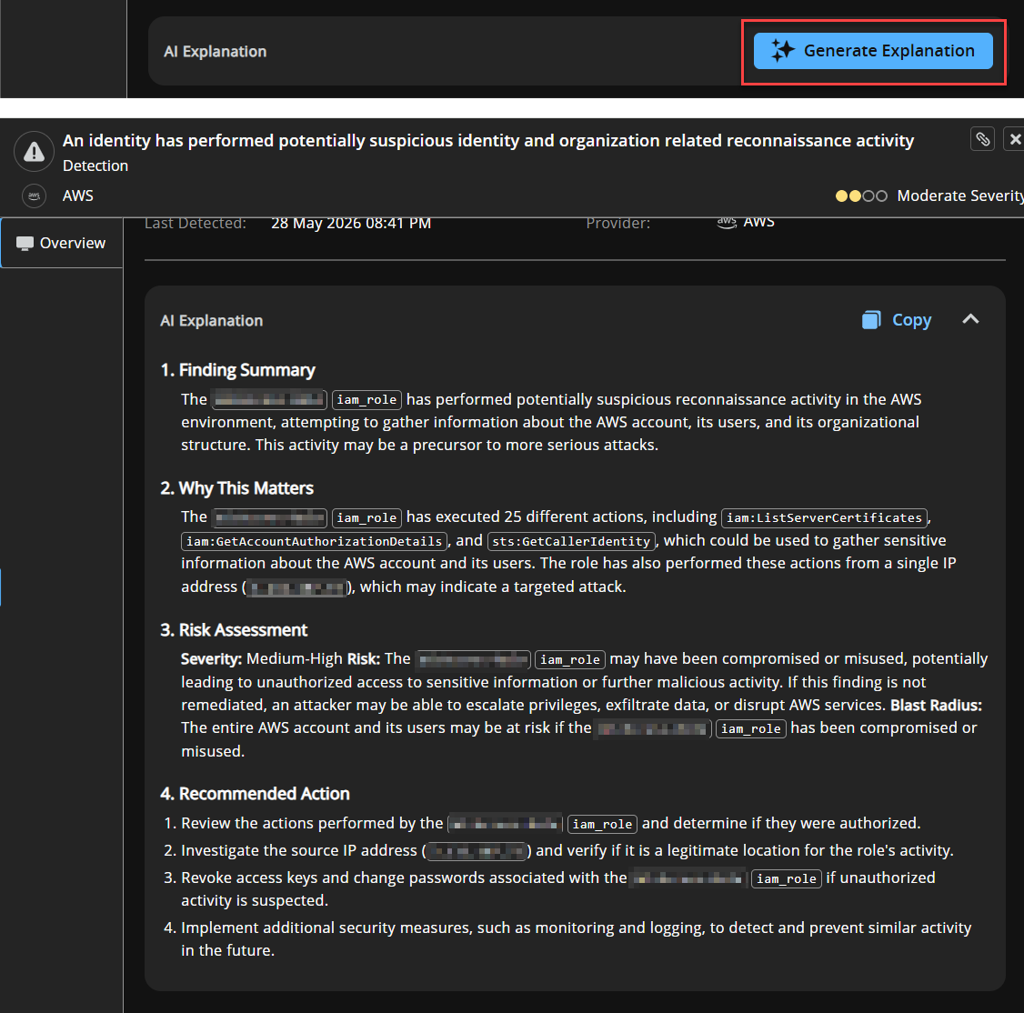
Turn detections and recommendations into a clear next step: Open any detection or recommendation and click Generate Explanation in the AI Explanation section. You get a tight summary of the finding, why it matters in your environment, a risk read with severity and blast radius, and concrete recommended actions to remediate it. Triage starts with "here's what to do" instead of "what am I looking at."
-
Streamed in real time, then ready to share: The explanation streams in as it's generated, so you start reading within seconds instead of waiting on a spinner. When it's done, copy the whole thing to your clipboard with one click; drop it straight into a ticket, an incident note, or a message to a teammate.
Important informationAI Explanations are off by default and are currently available to United States region sites only. To turn them on, set Identity Security Insights AI features to On under Platform AI Features in your site settings. Once turned on, the Explain Path and Generate Explanation buttons appear in the graph, detection, and recommendation panels for your users.
Why it matters
The hard part of identity security has never been seeing the data, it's interpreting it fast enough to act. Putting an explanation one click from the graph or finding closes the gap between "something's here" and "here's what it means and what I should do."
✨ Enhancements
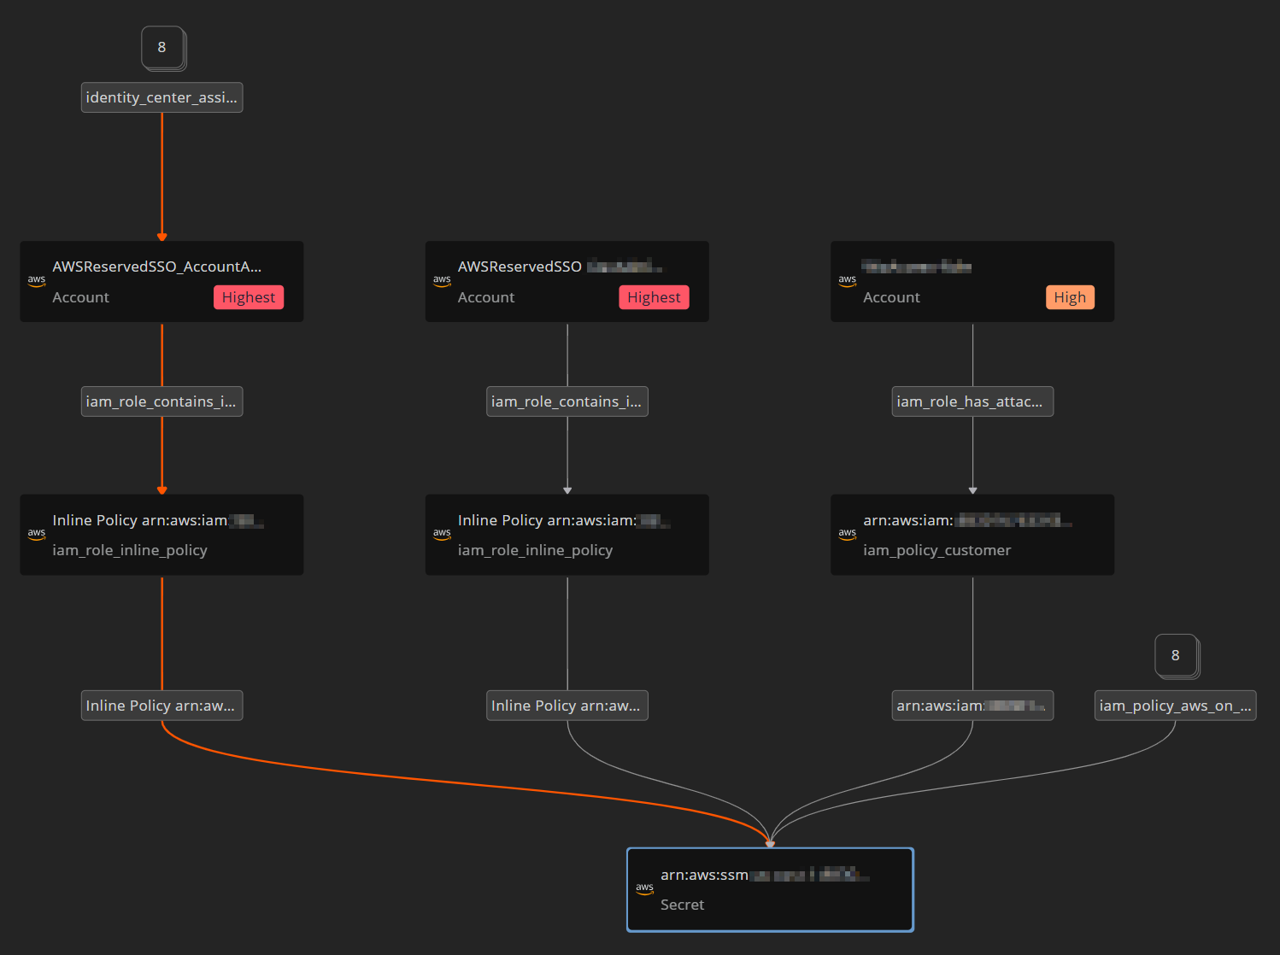
Escalation paths highlighted
When a graph contains a privilege escalation path, it now stands out, highlighted in orange with bolder edges and arrows, along with the nodes it runs through.
The highlight follows the path itself, so it appears wherever an escalation path shows up in your side-panel graphs (Secrets, AI Agents, Entitlements, and Accounts) and remains visible at any zoom level.
Quality-of-Life upgrades across Insights
This release also includes several usability improvements: copying long values, navigating to a secret in AWS, and reviewing findings are all faster.
What you get with this update
-
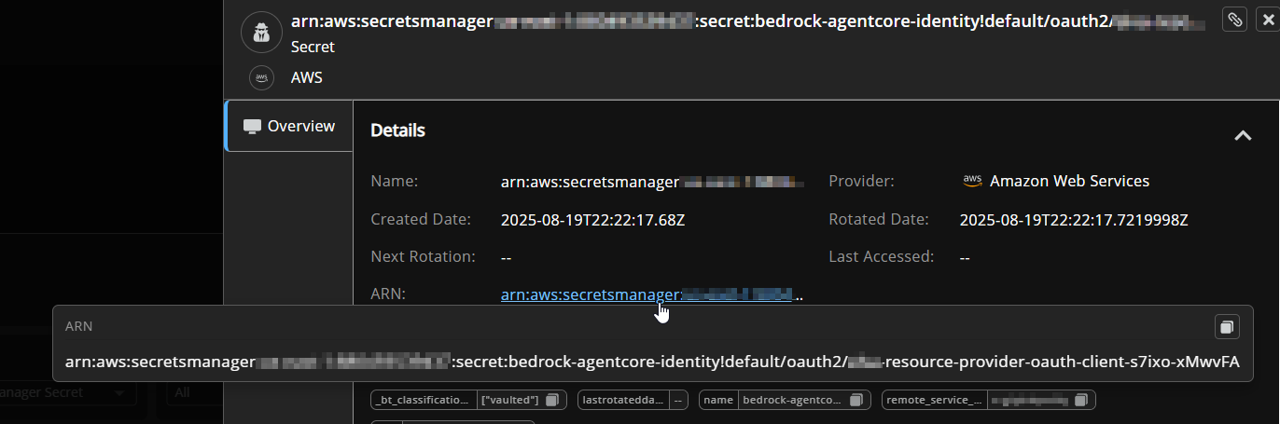
Copy any value in a click, no matter how long: Details panels now let you hover any field to surface its full value in a popup with a built-in copy button – so those long, truncated ARNs and identifiers are one click from your clipboard, with the icon confirming the copy landed.
-
Jump straight from a secret into AWS: The ARN of an AWS Secrets Manager secret is now a direct link – click it and land on that exact secret in the AWS console, in the right region, ready to inspect or manage.
-
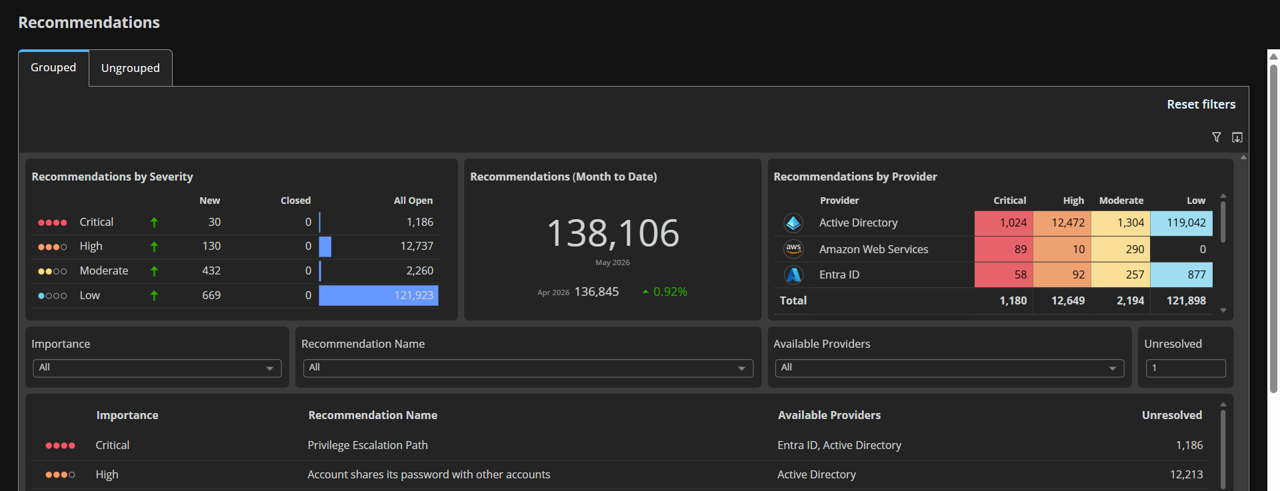
Size up Detections and Recommendations at a glance: The Detections and Recommendations landing pages now carry the same key visuals as your dashboard – a month-to-date summary, a breakdown by severity, and a breakdown by provider, all on a single row. Click any chart to drop straight into the matching filtered view, so you go from "what's my posture this month" to the exact set of findings in one click.
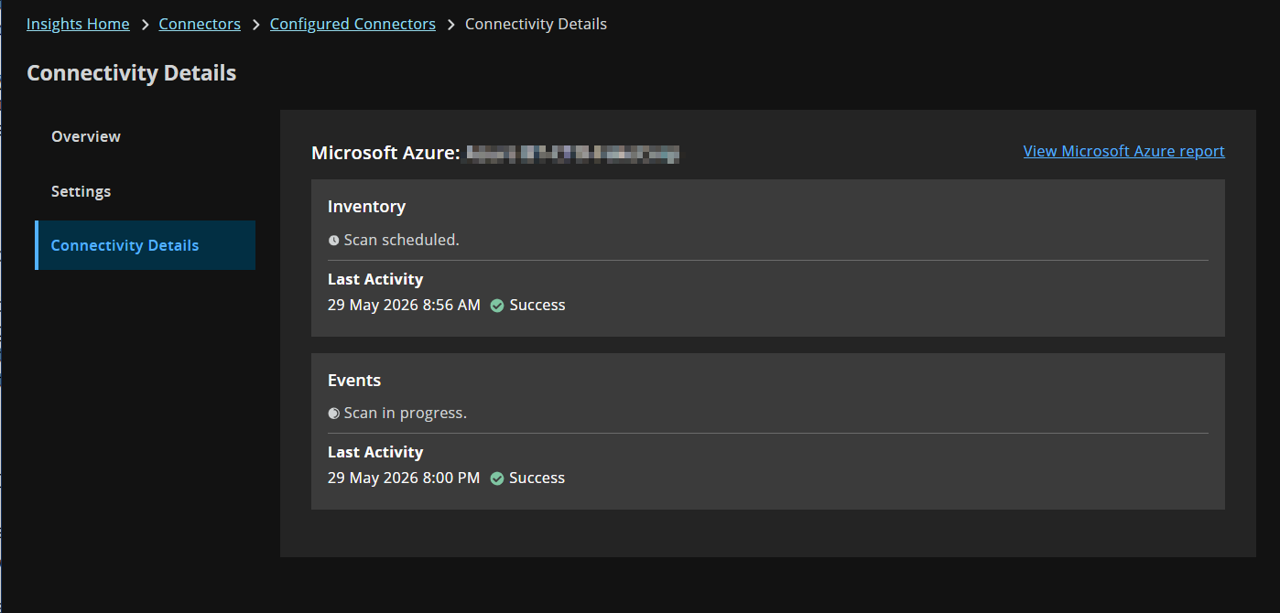
See your connectors working
Connector status now updates in real time during scanning activity. The connectivity details panel displays In Progress while a scan is running and Scheduled when a scan is queued. This is useful after adding a new connector or toggling an existing one, as the current scan state is immediately visible without any additional steps.